
Relationship between Nitrogen Use Efficiency and Response Index in Winter Wheat
Daryl B. Arnall, Brenda S. Tubaña, Starr L. Holtz, Kefyalew Girma and W.R. Raun
ABSTRACT
Although nitrogen use efficiency (NUE) of small grains is well documented at 33% world wide, there has been little research relating NUE to yield factors. This study examined the relationship between NUE and the response index at harvest (RIHARVEST) of winter wheat (Triticum aestivum L.). Yield data from a long-term fertility study established at Lahoma, Oklahoma in 1971 was used to explore the relationship. In this report, six N rates at non-limiting levels of P and K were evaluated. Regression analysis showed a positive relationship between NUE and RIHARVEST for all years across all N rates (r2 = 0.37). But this relationship was improved (r2 = 0.45) when both RINDVI and RIHARVEST were included in the model. The linear relationship between NUE and RIHARVEST was significantly improved, when yield data and corresponding NUE were separated according to the annually applied fixed N rate. As the N rate increased the resulting slope of the relationship between NUE and RI was reduced. These analyses also demonstrate that temporal variability in NUE exists and that NUE can be predicted.
Keywords: Nitrogen Use Efficiency, Response Index, winter wheat, Normalized Difference Vegetation Index, Nitrogen
INTRODUCTION
As the cost of nitrogen (N) fertilizer increases and profit in winter wheat (Triticum aestivum L.) production is put at risk, scientists are challenged to develop N management strategies that guarantee increased N use efficiency (NUE). Baligar et al. (2001) concluded that increased NUE in plants is vital to enhance the yield and quality of crops, reduce N inputs and improve soil, water and air quality. Farmers either under- or over-fertilize, both of which will result in profit loss. Reduced N application will cause reduction in head size, poor grain fill and reduced tillers per plant resulting in decreased grain yield (Barley and Naidu, 1964; Syme, 1967; Halse et al., 1969; Pearman et al. 1978). On the other hand, over fertilization of N may not always result in additional grain yield but instead can increase N losses (Raun and Johnson, 1995; Reddy and Reddy, 1993; Kanampiu et al., 1997) and subsequent environmental contamination.
Winter wheat producers in the Great Plains generally apply N fertilizer either once before planting or in split applications (Kelley, 1995). A mid-season split application of N fertilizer provides room for adjusting rates according to crop growth thus maximum utilization of fertilizer is expected (Mascagani and Sabbe, 1991; Boman et al., 1995). This N management strategy can be further improved by applying mid-season N rates based on what the crop needs to maximize yield and minimize input costs.
An approach to maximize NUE currently in use at Oklahoma State University is the mid-season fertilizer N rate based on predicted yield potential. Early work showed that the normalized-difference-vegetative-index (NDVI) could be used to estimate green biomass (Tucker, 1979). Raun et al. (2001) established an equation to predict crop yield potential (YP0) using an in-season estimate of yield (INSEY), an index determined by dividing NDVI sensor readings collected mid- season by the total number of positive growing degree days (GDD>0) from day of planting to sensing. The GDD>0 is calculated as Tmin+Tmax/2 –4.4ºC. They also reported that the coefficient of determination (R2) between actual grain yield and INSEY from six out of nine locations across a two-year period was 83%. Raun et al. (2005) stated that application rates should be based on removal of predicted yield potential of the crop. The average N concentration in wheat grain is 2.39% thus, the removal amounts can be estimated based on a projected yield. Raun et al. (2005) discussed that the estimation of N fertilizer requirement is based on components other than just predicted yield potential. Estimating temporally dependent responsiveness to applied N is also an important component of the algorithm since the amount of N mineralized year to year can be dramatically variable. Johnson and Raun (2003) presented data from a long-term fertilizer trial (established in the early 1970s) in which there were years that the check plot (0-N applied for over 30 years) produced near maximum yields and thus the demand for fertilizer N was small. The response index (RI) concept was introduced to describe the crops likeliness to respond to applied fertilizer N (Johnson and Raun, 2003). Recognizing its importance in precise estimation of N rate, in-season RI was incorporated in the algorithm which Mullen et al. (2003) showed can be estimated early in the season using NDVI sensor readings. Another important component of the algorithm is the coefficient of variation. Normalized difference vegetation index (NDVI) readings from good stands yet nutrient deficient can be different from poor stands of nutrient enriched wheat. The coefficient of variation (CV) from NDVI readings can be used to predict early season plant stands (Arnall et al., 2006) and thus was incorporated into the algorithm for estimating mid-season N rate (Raun et al., 2005).
The current algorithm employed at Oklahoma State University uses the predicted yield potential (YP0) and estimated response index (RI) from NDVI readings to predict yield potential when N is applied (YPN) and simultaneously altered using the CV (Raun et al., 2005). Nitrogen fertilizer rate is then determined by dividing the difference in grain N uptake of YPN and YP0 by the NUE. The NUE factor used in the algorithm is estimated through historical data. Knowing that NUE is affected by soil properties, efficiency of crops, climate, and chemical species of fertilizer used, mycorrhiza, and others (Baligar and Bennett, 1986a and b; Fageria, 1992; Hauck, 1985), adjusting NUE in-season has the potential to refine the present algorithm. A thorough examination of the relationship with NUE and grain yield from previous data and understanding how the behavior of this relationship is affected by dynamic factors present in the field are essential steps that have not been assessed in the course of improving NUE.
A study by Ellen and Spiertz (1980) showed that fertilizer NUE determined using wheat grain yield, changes with time and rate of application. While grain yield and N content of cereal grain crops increased with applied N (Simonis, 1987; Raun and Johnson, 1995), higher N rates generally result in decreased NUE values.
In this study, data collected from a long-term continuous winter wheat trial at Lahoma Research Station were used to examine the relationship between NUE, and response index of harvested grain to nitrogen fertilizer (RIHARVEST) and the response index of NDVI (determined from mid-season NDVI measurements) to nitrogen fertilizer RINDVI.
MATERIALS AND METHODS
Nitrogen use efficiency was calculated from grain yield data collected from a long-term experiment established in the fall of 1970 under conventional tillage on a well drained, deep and moderately permeable Grant silt loam (fine-silty, mixed, thermic Udic Arguistoll) soil located at the North Central Research Station near Lahoma (36.42° N and 97.87° W at an altitude of 396 m a.s.l.), OK. The average annual rainfall at Lahoma is approximately 800 mm. The treatment structure of the entire experiment consists six N rates (0, 22, 45, 67, 90 and 112 kg N ha-1), five phosphorus (P) rates (0, 5, 10, 14 and 20 kg P ha-1) and two rates of potassium (0 and 56 kg K ha-1) arranged in a randomized complete block design (RCBD) with four replications. In this report, the six N rates at fixed levels of 20 kg P ha-1 and 56 kg K ha-1 (non-limiting P and K) were evaluated. Nitrogen, P, and K were applied as ammonium nitrate (34% N), triple super phosphate (20% P) and potassium chloride (83% K), respectively. Plots are permanent from year to year and received fixed rates of N, P and K every year. Individual plots are 4.9 m wide and 18.3 m long. Winter wheat was planted for 34 continuous years in 25.4 cm wide rows at seeding rates of 67 kg ha-1. In some years the seeding rate was increased to 110 kg ha-1 to account for expected poor germination and reduced tillering due to dry soil condition or late planting date.
Over the period of the trial, wheat varieties have changed following practices of the local producers. The variety 'Nicoma' was planted from 1971-1974, 'Triumph 64' from 1975-1976 and 1978, 'Osage' in 1977 and 1979, 'TAM W-101' from 1980-1991, ‘Karl’ from 1993-1994, ‘Tonkawa’ from 1995-1998, ‘Custer’ from 1999-2004, and ‘Overley’ from 2005 to the present. Preplant fertilizer was broadcast and incorporated in late August to mid September. Planting dates ranged from mid September to late October with the harvest dates ranging from the first of June to mid July.
Grain was harvested from the center 2 m of each plot using a conventional combine. Grain yield from each plot was determined and a sub-sample was collected for total N analysis. Grain samples were dried in a forced air oven at 66 oC, ground to pass a 140 mesh sieve (100 μm), and analyzed for total N content using a Carlo-Erba NA 1500 automated dry combustion analyzer, using the methods outlined in Schepers et al. (1989).
In general, NUE is defined as the total plant N divided by the amount applied (e.g. Liang and Mackenzie, 1994). However in this study, we calculated NUE as uptake efficiency (the difference of N uptake in the treated plot and N uptake in the 0-N check) divided by the total applied N rate.
Response index of harvested grain was determined as the ratio of yield of fertilized and check plot for each N rate in each year. Response index of NDVI was calculated for the yearly NDVI data since 1998 as the ratio of NDVI of N fertilized and unfertilized check plot for each N level. Normalized Difference Vegetation Index was taken with a GreenSeeker® Hand Held active (self-illuminated) optical sensor (NTech Industries, Inc.). The sensor uses a patented technique to measure crop reflectance in the red (650 ± 10 nm) and near infrared (770 ± 15 nm) bands and to calculate NDVI (Raun et al., 2005b; Stone et al., 2005).
Linear regression analysis between RIHARVEST or RINDVI and NUE was performed for each level of N (n= 34 for RIHARVEST versus NUE and n= 30 for RINDVI versus NUE) and all N rates combined. The analysis included a test of significance of slope and intercept from the linear regression for the different N rates for both RIHARVEST versus Nitrogen Use Efficiency and RINDVI versus NUE regressions. NUE was also regressed on both RIHARVEST and RINDVI. This regression also included collinearity analysis using the Variance Inflation Factor (VIF) diagnostics tool (Neter et al., 1990). All statistical data analyses were performed using the General Linear Model (GLM), Regression (REG) and Mixed (MIXED) procedures in SAS (SAS Inst., 2001).
RESULTS AND DISCUSSION
Varieties were changed eight times over the years in this study. Preliminary analysis of yield among varieties revealed no significant differences. Thus the change of cultivar over years did not have an impact on NUE and RI data. Each year the best available variety was used. Figure 1 presents wheat grain yield data (1971 to 2005) from three treatments: 0-20-56, 67-20-56, and 112-20-56 kg N-P-K ha-1. The yield of the check plot ranged from 0.7 to 2.7 Mg ha-1 while the 112 kg ha-1 N rate ranged from 1.4 to 5.9 Mg ha-1. The yields for the 67-20-56 treatment ranged from 1.7 to 5.1 Mg ha-1. However, the data communicates a more profound problem of N management i.e. annual N demand being highly variable. Raun et al. (2005a) conceptualized the use of yield potential which addressed the limitations imposed by temporal and spatial variability in N decision management. It was discussed that among the components of the functional algorithm used to estimate N rate is NUE. Currently, the sensor-based nitrogen rate calculator (http://www.soiltesting.okstate.edu/SBNRC/SBNRC.php) allows users to input NUE values with the suggested range being from 0.5 to 0.7.
Yield is a function of the combined effects of different factors during crop growth and development. These factors change every cropping season affecting the availability of N and as a result, there were years (1971, 1978 and 1982) where plots that received no N fertilizer obtained the same grain yield as those plots which received 112 kg N ha-1 (Figure 1). Alternatively in 1987 and 2002, grain yield was doubled when N was applied at a rate of 112 kg N ha-1 over that of the check. It can be seen that the 67 kg N ha-1 often met or exceeded the yield of the 112 kg N ha-1 (Figure 1). This indicated that the 112 kg N ha-1 rate was at times excessive leading to a lowered NUE.
Averaged over N rates, the relationship between RIHARVEST versus NUE (Figure 2) and RINDVI versus NUE (data not shown) were not strong (coefficient of determination, r2 =0.37, p<0.05 and 0.20, P>0.1, respectively). When the RIHARVEST versus NUE relationship was assessed by each N rate, a positive linear relationship was observed (Figure 4-8), but the r2 values were significantly improved to as high as 0.72 with increased N rates. Similarly, the r2 of the relationship between RINDVI and NUE increased with N rate (r2= 0.03, 0.16, 0.21, 0.27 and 0.28 for 22, 45, 67, 90 and 112 kg ha-1 N rates, respectively). The test of slope and intercept however revealed that none of the two parameters were significantly different between any two N rates. When NUE was regressed on RIHARVEST, the increase in NUE due to N application diminished as the N rate increased. This was verified by the negative correlation between slope values (unit increase in NUE for every unit increase of RI) obtained from the regression models and N rate (Figure 9). Nitrogen use efficiency is a measure of N uptake per unit of N applied and since grain yield does not proportionately increase with N applied, further increase in N rates would only reduce NUE.
Alternatively, the regression of NUE on RINDVI for 9-year data did show an increasing slope with increased N rate. The NDVI, while a good indicator of biomass production, has moderate (r2= 0.5) association with final grain yield but it is good for estimating in-season biomass production and thus forage N uptake.
The regression of NUE on both RIHARVEST and RINDVI revealed that inclusion of both variables resulted in r2 of 0.45 when data was combined over N rates for 1998 to 2006 data (Figure 10). The model was given by: NUE = -13 + 21*RINDVI + 21*RIHARVEST. The collinearity diagnostics revealed that the VIF was 1.15 for both predictor variables indicating little collinearity between predictor variables. This shows that the contribution of each predictor in explaining the variability in NUE was real although the contribution of RINDVI was small when it is added to the model as a first or second predictor variable. Despite the fact that RIHARVEST was better related to NUE than RINDVI, the inclusion of both improved the prediction of NUE.
CONCLUSIONS
The use of the RI is a powerful tool to predict NUE because RI has the ability to measure crop responsiveness to N-fertilizer. The RI encompasses the effect of environmental factors such as temperature and moisture which highly influences N transformations and directly affects crop growth. A linear relationship exists between RIHARVEST and NUE with r2 of 0.37. But this relationship was improved (r2 = 0.45 when both RINDVI and RIHARVEST were included in the model.
The relationship between RIHARVEST and NUE was significantly improved when data was analyzed by each N level. The estimation of NUE mid-season as a function of RIHARVEST is therefore achievable using the equation shown in Figure 2 or from the individual N rates. When NDVI measurement is available the estimation can be even more reliable. However, further research needs to be conducted to define the relationship between NUE and RIHARVEST when N is applied top-dress and when N application is split between pre-plant and topdress applications.
The relationship established between RIHARVEST and NUE and the ability to collect the RINDVI measurements in-season using GreenSeeker™ Hand Held sensors has opened another opportunity to customize the functional algorithm based on factors controlling final yield and NUE.
REFERENCES
Arnall D.B., W.R. Raun, J.B. Solie, M.L. Stone, G.V. Johnson, K. Desta, K.W. Freeman, R.K. Teal, and K.L. Martin. 2006. Relationship between coefficient of variation measured by spectral reflectance and plant density at early growth stage. Journal of Plant Nutrition 29: 1983–1997.
Baligar, V.C.,and O.L. Bennett. 1986a. Outlook on fertilizer use efficiency in the tropics. Fertilizer Research 10:83-96.
Baligar, V.C., and O.L. Bennett. 1986b. NPK-fertilizer efficiency--a situation analysis for the tropics. Fertilizer Research 10:147-164.
Baligar, V.C., N.K. Fageria, and Z.L. He. 2001. Nutrient use efficiency in plants. Communications in Soil Science and Plant Analysis 32:921-950.
Barley, K.P., and N.A. Naidu. 1964. The performance of three Australian wheat varieties at high levels of nitrogen supply. Australian Journal of Experimental Agriculture and Animal Husbandry 4:39-48.
Blackmer, T.M., J. S. Schepers, and Varvel, G.E. 1994. Light reflectance compared with other nitrogen stress measurements in corn leaves. Agronomy Journal 86:934-938.
Boman, R.K., R.L. Westernman, W.R. Raun, and M.E. Jojola. 1995. Spring-applied nitrogen fertilizer influence on winter wheat and residual soil nitrate. Journal of Production Agriculture 8:584-589.
Ellen, J. and J.H.J. Spiertz. 1980. Effects of rate and timing of nitrogen dressings on grain yield formation of winter wheat. Fertilizer Research 1:177-190.
Fageria, N.K. 1992. Maximizing crop yield. Marcel Dekker, New York, NY.
Fox, R. H., W.P. Piekielek, and K.E. Macneal.2001. Comparison of late-season diagnostic tests for predicting nitrogen status of corn. Agronomy Journal 93:590-597.
Halse, N.J., E.A.N. Greenwood, P. Lapins and D.A.P. Boundy. 1969. An analysis of the effects of nitrogen deficiency on the growth and yield of a Western Australian wheat crop. Australian Journal of Agricultural Research 20:987-998.
Hauck, R.D. 1985. Slow-release and bioinhibitor-amended nitrogen fertilizers, p. 293-322. Soil Science Society of America Journal, c1985, Madison, WI.
Johnson, G.V. and W.R. Raun. 2003. Nitrogen response index as a guide to fertilizer management. Journal of Plant Nutrition 26:249-262.
Kanampiu, F.K., W.R. Raun and G.V. Johnson. 1997. Effect of nitrogen rate on plant nitrogen loss in winter wheat varieties. Journal of Plant Nutrition 20:389-404.
Kelley, K.W. 1995. Rate and time of nitrogen applications for wheat following different crops. Journal of Production Agriculture 8:339-345.
Liang, B.C., and A.F. MacKenzie. 1994. Corn yield, nitrogen uptake and nitrogen use efficiency as influenced by nitrogen fertilization. Can. J. Soil Sci. 74:235-240.
Mascagani, H.J. Jr., and W.E. Sabbe. 1991. Late spring nitrogen application on wheat on a poorly drained soil. Journal of Plant Nutrition 14:1091-1103.
Mullen R.W, K.W. Freeman, W.R. Raun, G.V. Johnson, M.L. Stone, and J.B. Solie. 2003. Identifying an in-season response index and the potential to increase wheat yield with nitrogen. Agronomy Journal 95:347-351.
Neter, J., W. Wasserman, and M.H. Kutner. 1990. Applied linear statistical models, 3rd ed. Boston, MA: Irwin Inc.
Pearman, I., S.M. Thomas and G.N. Thorne. 1978. Effect of nitrogen fertilizer on growth and semi-dwarf and tall varieties of winter wheat. J. Agric Sci. 91:31-45.
Raun, W.R., and G.V. Johnson. 1995. Soil-plant buffering of inorganic nitrogen in continuous winter wheat. Agronomy Journal 87:827-834.
Raun WR, Johnson, GV, Solie JB, Stone, ML. 2005. A process for in-season fertilizer nitrogen application based on predicted yield potential. U.S. Patent. 6,880,291.
Raun, W.R., J.B. Solie, G.V. Johnson, M.L. Stone, E.V. Lukina, W.E. Thomason and J.S. Schepers. 2001. In-season prediction of potential grain yield in winter wheat using canopy reflectance. Agronomy Journal 93:583-589.
Raun, W.R., J.B. Solie, M.L. Stone, K.L. Martin, K.W. Freeman, R.W. Mullen, H. Zhang, J.S. Schepers, and G.V. Johnson. 2005. Optical Sensor Based Algorithm for Crop Nitrogen Fertilization. Communications in Soil Science and Plant Analysis 36:2759-2781.
Reddy, G.B. and K.R. Reddy. 1993. Fate of nitrogen-15 enriched ammonium nitrate applied to corn. Soil Science Society of America Journal 57:111-115.
SAS Institute. 2001. SAS/STAT User’s Guide. Release 8.1 ed. SAS Inst., Cary, NC.
Schepers, J. S., D. D. Francis, and M. T. Thompson. 1989. Simultaneous determination of total C, total N and 15N on soil and plant material. Communications in Soil Science and Plant Analysis 20:949-959.
Stone ML, Needham D, Solie JB, Raun WR, Johnson GV. 2005. Optical spectral reflectance sensor and controller. U.S. Patent. 6,855,933, Cont. of 6,596,996.
Simonis, A.D. 1987. Studies on nitrogen use efficiency in cereals. In D.S. Jenkinson and K.A. Smith (ed). Nitrogen Efficiency in Agricultural Soils. pp.110-124. Elsevier Science.
Syme, J.R. 1967. Growth and yield of irrigated wheat varieties at several rates of nitrogen fertilizer. Australian Journal of Experimental Agriculture and Animal Husbandry 7:337-341.
Tucker, C.J. 1979. Red and photographic infrared linear combinations for monitoring vegetations. Remote Sensing of Environment 8:127-150.
Table 1. Winter wheat grain yield (Mg ha-1) averaged over three year intervals at Lahoma, OK, 1971-2006.
|
N rate, kg ha-1 |
Grain yield (Mg ha-1) |
|||||||||||
|
1971-74 |
1975-77 |
1978-80 |
1981-83 |
1984-86 |
1987-89 |
1990-92 |
1993-95 |
1996-98 |
1999-01 |
2002-04 |
2005-06† |
|
|
check‡ |
1.764 |
1.565 |
1.834 |
1.785 |
2.094 |
1.707 |
1.589 |
1.306 |
1.393 |
1.203 |
1.972 |
2.174 |
|
0 |
1.819 |
1.503 |
1.775 |
1.917 |
2.109 |
1.695 |
1.500 |
1.291 |
1.462 |
1.588 |
2.152 |
1.962 |
|
22 |
2.023 |
1.999 |
2.226 |
2.595 |
2.613 |
2.525 |
2.167 |
1.692 |
1.896 |
1.772 |
2.920 |
2.256 |
|
45 |
2.095 |
2.238 |
2.394 |
2.613 |
2.687 |
2.836 |
2.489 |
2.062 |
2.187 |
2.120 |
3.404 |
2.326 |
|
67 |
2.028 |
2.592 |
2.920 |
2.659 |
2.772 |
3.124 |
2.610 |
2.495 |
2.612 |
2.388 |
3.900 |
2.417 |
|
90 |
1.974 |
2.808 |
3.298 |
2.573 |
2.710 |
3.371 |
2.638 |
2.764 |
2.967 |
2.712 |
4.211 |
2.657 |
|
112 |
1.950 |
2.825 |
2.989 |
2.330 |
2.611 |
3.248 |
2.511 |
2.858 |
3.319 |
2.567 |
4.324 |
2.805 |
|
SED§ |
0.205 |
0.264 |
0.248 |
0.185 |
0.239 |
0.221 |
0.21 |
0.24 |
0.252 |
0.419 |
0.263 |
0.181 |
† two year average
‡ did not receive any fertilizer since the inception of the experiment
§ Standard error of the difference of two equally replicated means
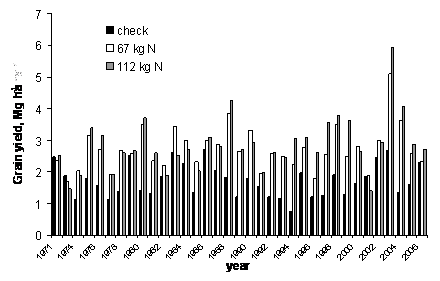
Figure 1. Grain yield (Mg ha-1) treatment means from a check (0-20-56 kg N-P-K ha-1) and two N treatments (67-20-56, and 112-20-56 kg N-P-K ha-1). The data was collected from the long-term fertility experiment 502, located in Lahoma, OK, 1971-2004.
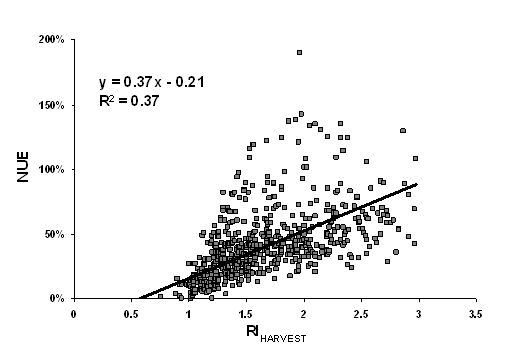
Figure 2. Regression
of NUE (
Figure 3. Regression
of NUE (
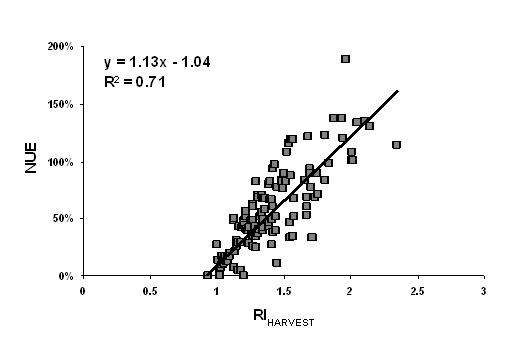
Figure 4. Regression
of NUE (
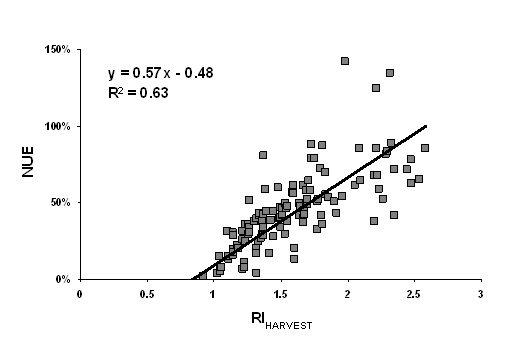
Figure 5. Regression
of NUE (
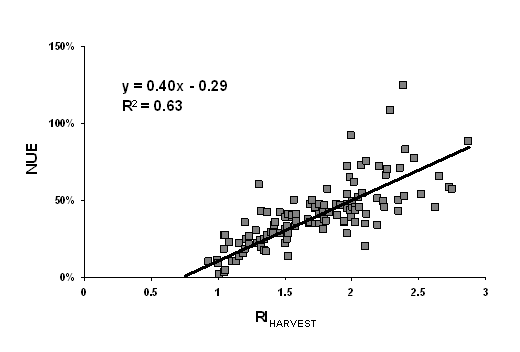
Figure 6. Regression
of NUE (
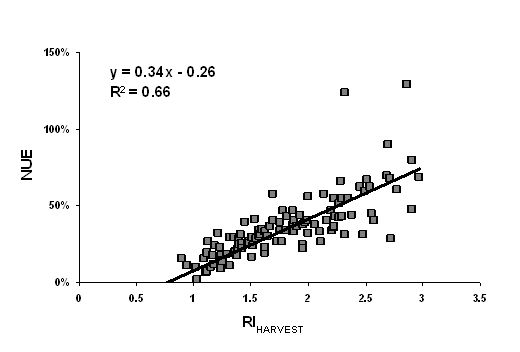
Figure 7. Regression
of NUE (

Figure 8. Regression
of NUE (
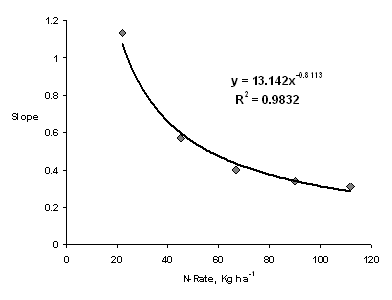
Figure 9. Relationship between N rate and the slopes obtained from the regression of RIHARVEST on NUE; model significant at p<0.001.
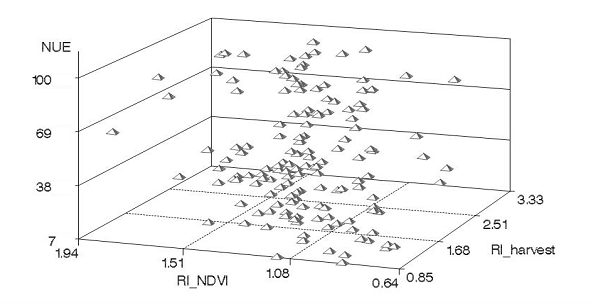
Figure 10. Plot of
NUE (