Increased plant N
loss with increasing nitrogen applied in winter wheat observed with 15N.
J. Plant Nutr. 23:219-230.
Increased Plant N Loss with Increasing N Applied in Winter Wheat Observed With 15N
http://www.nue.okstate.edu/Index_Publications/Plant_N_Loss_Lees.pdf
H.L. Lees, W.R. Raun* , and G.V. Johnson1
1Department of Plant and Soil Sciences, Oklahoma State University, Stillwater, OK 74078-0507. * Corresponding author, email: wrr@agr.okstate.edu
ABSTRACT
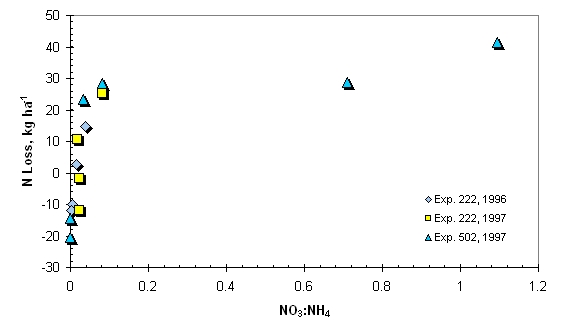
Nitrogen (N) fertilizer is generally the most costly input for winter wheat (Triticum aestivum L.) production. Therefore, it is important to maximize fertilizer use efficiency and minimize nitrogen losses to the environment. One of the mechanisms responsible for decreased nitrogen use efficiency (NUE) is plant N loss. The objectives of this experiment were to determine fertilizer N recovery in winter wheat when produced for forage and grain, and to quantify potential plant N losses from flowering to maturity in winter wheat. Two long-term (>25 years) winter wheat (Triticum aestivum L.) nitrogen (N) rate fertility experiments (Experiment 222 and Experiment 502) were selected to evaluate 15N fertilizer recovery. Percent 15N recovery was determined from all microplots in plant tissue at flowering, in the grain and straw at harvest and in the soil. Fertilizer N (15NH415NO3) was applied at rates of 0, 45, 90, and 135 kg N ha-1 in Experiment 222, and 0, 22, 45, 67, 90, and 112 kg N ha-1 in Experiment 502. The ratio of NO3- to NH4+ in wheat forage at flowering was positively correlated with estimated plant N loss. Estimated plant N loss (total N uptake in wheat at flowering minus N uptake in the grain and straw at maturity) ranged from a net gain of 12 kg N ha-1 to a loss of 42 kg N ha-1, and losses increased with increasing N applied.
INTRODUCTION
Recovery of fertilizer N in crop production systems has been thoroughly investigated, yet, N balance studies seldom account for more than 50% of the fertilizer N applied (Rasmussen and Rohde, 1991). In addition, comprehensive evaluation of soil and plant sinks has failed to produce 100% recoveries. Carter et al. (1967) found most of the applied N was either taken up into the plant or kept in the top 15 cm of the soil profile. Webster et al. (1986) found 22% of the fertilizer applied in the first year remained in the soil at the end of the growing season; slightly more than half of which was found in the upper 15 cm. Olson et al. (1979) found 70-75% of the total fertilizer N was in the top 10 cm of the soil profile, while 70-91% was in the top 20 cm. Reddy and Reddy (1993) found that the first 15 cm of the soil profile contained one-half of the residual N. Harris et al. (1994) noted that the microbial biomass recovered up to 6% of the applied fertilizer N, while the nonbiomass organic fraction contained 14% of the applied N.
Movement of N through the soil profile did not reach beyond the sampling zone during a growing season that received 208 mm of rainfall (Carter et al., 1967). Webster et al. (1986) observed little leaching loss (less than 1% in the first year and 1.3 and 3.9% over 5 and 6 year time periods). Research employing 15N has shown that the plant removes between 40 and 58% of the applied fertilizer N in the growing season that the fertilizer was applied in, while the grain accounts for 27 to 33% (Olson and Swallow, 1984). Reddy and Reddy (1993), examining corn, found that applied fertilizer N recoveries ranged from 17 to 20% in the grain. Webster et al. (1986) found after five and six years had passed, total N recoveries were 49 and 62%. Harris et al. (1994) stated that 40% of applied fertilizer N was removed by the crop.
Work by Raun and Johnson (1995) indicates that the soil-plant system can buffer against soil profile inorganic N accumulation when N rates exceed that required for maximum yield. Increased plant N loss when N rates exceeded that required for maximum yield was proposed as one the the buffering mechanisms (Raun and Johnson, 1995). Francis et al. (1993) noted that plant N losses accounted for 52-73% of the unaccounted-for N in 15N balance calculations. Moreover, they found most plant N losses occurred after anthesis, and plant N loss was greater at higher rates of N. Harper et al. (1987) found 21% of applied fertilizer N was lost as volatile ammonia during senescence and approximately 11% of the potential N available for redistribution from stems and leaves was lost as volatile ammonia in wheat. Daigger et al. (1976) found total N losses from 25 to 80 kg ha-1 in winter wheat. Stutte et al. (1979) discovered that soybeans lost more N during early vegetative growth stages than during flowering and pod fill. Morgan and Parton (1989) found grain fill produced the highest rates of ammonia volatilization in spring wheat, with especially high levels of ammonia volatilization occurring after anthesis and prior to maturity. Reddy and Reddy (1993) found unaccounted N losses were 11 to 18% at 100 kg N ha-1 and 34 to 48% for 200 kg N ha-1. This finding is consistent with Raun and Johnson (1995) who noted that losses (other than leaching) can increase at the higher rates of applied N.
In corn plants, post-anthesis N losses from aboveground biomass ranged from 10 to 20% of the fertilizer applied (Francis et al., 1993). Plant N loss was maximized at the N fertilization rate where the greatest leaf area occurred. Work by Kanampiu et al. (1997) documented plant N losses in winter wheat that ranged from 8 to 26 kg N ha-1, and that losses increased with increasing rates of N application.
Harris et al. (1994) found more applied fertilizer N loss during a drought year than during a normal one. Olson et al. (1979) found 100 kg N ha-1 rate plots had twice as much fertilizer N that was unaccounted for as did the 50 kg N ha-1 rate plots. They also found most of the fertilizer remaining in the soil was in the top 0-10 cm layer of soil, with no sign of N below 50 cm. Olson et al. (1979) concluded that unaccounted N losses were not due to leaching, but to gaseous losses. Carter et al. (1967) concluded N was lost in the gaseous form throughout the year, but was more intense in the warmer months.
Unaccountable fertilizer N losses have been attributed to volatilization (both from the soil and from the plant), denitrification, and leaching. Webster et al. (1986) blamed denitrification processes for unaccounted N losses of 11% in the first year. Olson and Swallow (1984) found a direct relationship between the amount of fertilizer nitrate present in the topsoil and the amount of N unaccounted.
The objectives of this experiment were to determine fertilizer N recovery in winter wheat when produced for forage and grain, and to quantify potential plant N losses from flowering to maturity in winter wheat.
MATERIALS AND METHODS
Two long-term soil fertility experiments were selected for further study, Experiment 222 at Stillwater and Experiment 502 at Lahoma, Oklahoma. In the first year of this study, only Experiment 222 was used. Experiment 222 was conducted on a Kirkland silt loam (fine, mixed, thermic Udertic Paleustoll). Experiments 222 and 502 are both long-term fertility trials that receive annual applications of N, P and K incorporated preplant in a conventional tillage continuous winter wheat production system. The treatments selected for 15N microplots were those where N rates varied, but annual P and K rates were constant. In the second year of this study, Experiment 222 was continued and another was initiated, Experiment 502 at Lahoma (Grant silt loam, fine, mixed thermic Typic Paleustoll), OK. Soil test levels at the initiation of each experiment are reported in Table 1.
The experimental design was a randomized complete block with 3 replications. Each plot measured 6.1 x 18.3 m. The area contained within the microplots was 32.8 x 76.2 cm. ‘Tonkawa’ winter wheat (Triticum aestivum L.) was sown at 67.2 kg ha-1. After the wheat stand was established, 32.8 x 76.2 cm microplot metal frames were installed in the center of each plot. Each frame spanned four rows of wheat.
Microplots were fertilized using 11.8881 percent atom excess 15NH415NO3 at Experiment 222 in November of 1995 and at Experiment 502 in November of 1996. Experiment 222 was fertilized with non-labeled ammonium nitrate fertilizer in the second year (October, 1996). Fertilizer N was applied at rates of 0, 45, 90, and 135 kg N ha-1 at Experiment 222. Phosphorus and potassium were applied to all plots at fixed rates of 29 and 38 kg ha-1, respectively. Fertilizer N was applied at rates of 0, 22, 45, 67, 90, and 112 kg N ha-1 in Experiment 502 with fixed rates of 20 kg P ha-1 and 56 kg K ha-1.
Soil cores, 2.22 cm in diameter, were taken to a depth of 250 cm in 1996 and to a depth of 120 m in 1997, and sectioned into 0-15 cm, 15-30 cm, 30-45 cm, 45-60 cm, 60-90 cm, 90-120 cm, 120-150 cm, 150-180 cm, 180-210 cm, and 210-240 cm. The soil cores were refrigerated at 10°C prior to processing. Soil samples were ground to pass a 150 um (No. 100) sieve.
Forage at flowering and grain and straw samples at maturity were taken from each plot. Forage samples were ground to pass a 75 um (No. 200) sieve, and NO3-N and NH4-N were determined following a 0.01 M calcium sulfate extraction using an automated flow injection analysis system (Lachat, 1989, 1990). The dilution factor was 100 for NH4+ and 10 for NO3-. Grain and forage harvest were conducted by hand due to the small size of the microplots. Main plots were harvested using a Massey Ferguson 8XP research combine. Yield was calculated for the forage, grain, and straw samples. Total N in the soil, forage, grain and straw was determined using a Carlo Erba NA-1500 dry combustion analyzer (Schepers et al., 1989). Soil, forage, grain and straw 15N were determined using a stable isotope ratio mass spectrometer. Atom percent excess 15N was calculated, correcting for natural abundance. Only the first 7 soil depths (0-150 cm), were used to determine percent fertilizer N recovery in Experiment 222 for 1996 as the latter depths contained insignificant amounts of 15N. Statistical analysis was performed using SAS (SAS Institute, 1985).
Two commonly used methods to determine percent fertilizer recovery were used in this study. Using the difference method, percent fertilizer recovery is equal to total N uptake in the fertilized plot minus total N uptake in the check plot divided by the rate of fertilizer applied. When using the isotope method, percent fertilizer recovery = (100P(c-b))/(f(a-b)); where P= total N in the plant part or soil in kg ha-1, f= rate of 15N fertilizer applied, a= atom percent 15N in labeled fertilizer, b= atom percent 15N in the plant part or soil receiving no 15N, and c= atom percent 15N in the plant part or soil that did receive 15N (Hauck and Bremner 1976). Nitrogen loss was determined by subtracting total N accumulated in the grain and straw at harvest from total N accumulated at flowering. In addition, N loss from 15N plots was estimated by subtracting percent recovery in the grain and straw at harvest from percent recovery in the forage at flowering.
Total precipitation from September to May was 267 and 585 mm for Experiment 222 in 1996 and 1997 cropping cycles and 657 mm for Experiment 502 in 1997. In general, the 1996 cropping cycle was dryer and warmer than 1997.
RESULTS AND DISCUSSION
Grain yield by treatment for both experiments is reported in Table 2. A significant linear increase in grain yield was observed at both sites and both years (Experiment 222) with increasing N rate. Estimated plant N loss/gain at Experiment 222 ranged from a net gain of 12.05 kg N ha-1 to a loss of 14.67 kg N ha-1 for the 45 and 135 kg N rates, respectively, in 1996 (Table 3). In the following year, N changes ranged from a net gain of 11.82 kg N ha-1, to a loss of 5.10 kg N ha-1 for the 0 and 135 kg N ha-1 plots, respectively. Estimated plant N loss/gain at Experiment 502 ranged from a gain of 20.48 to a loss of 41.55 kg N ha-1. Increased plant N loss with increasing N applied supports the buffering concept as proposed by Raun and Johnson (1995) since losses other than leaching increased at N rates greater than that required for maximum yield.
Estimated N loss using the difference in 15N recovery (N at flowering minus N in grain+straw at maturity) increased with increasing N rate at Experiment 222 in 1996, but was inconsistent for both experiments in 1997 (Table 4). This method reliably determines plant N loss from applied fertilizer 15N, but, should result in lower estimates than that determined using total N uptake (Table 3) since it does not account for N coming from the soil. The latter method includes N mineralized from the soil that has been estimated to be as much as 50% of the total N removed in cereals (Keeney, 1982). If more N were taken up (regardless of the source), estimates of loss would be greater using the difference method (total N uptake in the forage at flowering minus N uptake in the grain and straw at maturity, Table 3) than that obtained using the isotope method (Table 4).
Total fertilizer N recovery was estimated by summing the amounts found in the grain, straw and soil (two years for Experiment 222 and one year for Experiment 502, Table 5). This estimate does not account for N potentially lost via leaching, denitrification or through the plant as gaseous NH3. However, estimated total fertilizer N recovery was as high as 86 and 61% at experiments 222 and 502, respectively (Table 5).
Total fertilizer N recovery (as % of applied) was not affected by N rate for the grain at Experiment 222 in 1996 nor for the grain and straw in 1997 at Experiment 222 and 502 (Table 5). A linear trend for fertilizer N recovery to decrease with increasing N rate was observed for straw in 1996 at Experiment 222. Fertilizer N recovery in the soil (sum of amounts found within individually analyzed depths) decreased with increasing N applied at both locations. Because limited differences in fertilizer N recovery in the grain and straw were observed with increasing N rate, a significant decrease in fertilizer N recovery in the soil with increasing N applied suggests that the soil was a sink for loss. Leaching was an unlikely sink since only limited `N recovery was noted at depths > 30 cm, regardless of the rate of N applied (Figures 1 and 2). In all cases, more than half of the fertilizer was found in the first 30 cm. At depths beyond 30 cm, all had accumulated about the same amount of fertilizer. At depths> 150 cm, very little 15N above natural abundance was present at Experiment 222 in 1996.
Because of past work showing that large amounts of N are lost from the plant as NH3, we were interested in analyzing forage tissue at flowering for the presence of NH4+. Combined with NO3- it was thought that the relationship between the two inorganic N forms would demonstrate whether or not the plant had an excess and if reduction was taking place. The ratio of NO3- to NH4+ was significant for N rate at Experiment 222 in 1996 and at Experiment 502 in 1997. Correlation between NO3-:NH4+ and N loss at maturity was low at Experiment 222 in 1996, but was highly correlated (R2 = 0.47) in 1997. At Experiment 502 in 1997 the NO3-:NH4+ ratio was also correlated with N loss (R2 = 0.29). In 1997 at both experiments, NO3- concentration at flowering was related to our estimates of plant N loss at maturity. As the NO3-:NH4+ increased, estimated plant N loss increased (Figure 3).
CONCLUSIONS
Plant N loss plays a significant role in the efficiency of use of fertilizer N. In grain production systems, plant N loss is tied closely to N rate. As such, efforts should be made to minimize the amount of N fertilizer applied beyond the plant’s needs. Maximum nitrogen use efficiency generally takes place at low N rates and prior to the rate required for maximum yield.
This work showed that loss of N from the plant and soil increased with increasing N applied in two studies employing the use of 15N. Fertilizer N recovery accounting for 15N removed in the grain and straw and that remaining in the soil at the end of the experiment decreased with increasing N applied, which was consistent with increased N loss (plant volatilization and denitrification) with increasing N applied. Wheat was found to accumulate up to 190 kg N ha-1 in the forage by flowering, yet only 150 kg N ha-1 could be accounted for in the grain and straw at maturity. The ratio of NO3- to NH4+ in wheat forage at flowering was found to be correlated with estimated plant N loss. This may serve as a method of identifying potential plant N loss in order to increase N use efficiency via alternative management strategies.
REFERENCES
Carter, J.N., O.L. Bennett, and R.W. Pearson. 1967. Recovery of fertilizer nitrogen under field conditions using nitrogen-15. Soil Sci. Am. Proc., 31:50-56.
Daigger, L.A., D.H. Sander, and G.A. Peterson. 1976. Nitrogen content of winter wheat during growth and maturation. Agron J. 68:815-818.
Francis, D.D., J.S. Schepers, and M.F. Vigil. 1993. Post-anthesis nitrogen loss from corn. Agron. J. 85:659-663.
Harper, L.A., R.R. Sharpe, G.W. Langdale, and J.E. Giddens. 1987. Nitrogen cycling in a wheat crop: soil, plant, and aerial nitrogen transport. Agron. J. 79:965-973.
Harris, G.H., O.B. Hesterman, E.A. Paul, S.E. Peters, and R.R. Janke. 1994. Fate of legume and fertilizer nitrogen-15 in a long-term cropping systems experiment. Agron. J. 86:910-915.
Hauck, R.D. and J.M. Bremner. 1976. Use of tracers for soil and fertilizer nitrogen research. In N.C. Brady (ed.) Advances in Agronomy 28:219-266.
Kanampiu, F.K., W.R. Raun and G.V. Johnson. 1997. Effect of nitrogen rate on plant nitrogen loss in winter wheat varieties. J. of Plant Nutr. 20:389-404.
Keeney, Dennis R. 1982. Nitrogen management for maximum efficiency and minimum pollution. In Frank J. Stevenson (ed.) Nitrogen in agricultural soils. Agron. Monogr. 22. ASA, CSSA and SSSA, Madison, WI.
Lachat Instruments. 1989. Quickchem method 12-107-04-1-B. Lachat Instr., Milwaukee, WI.
Lachat Instruments. 1990. Quickchem method 12-107-06-1-B. Lachat Instr., Milwaukee, WI.
Morgan, J.A. and W.J. Parton. 1989. Characteristics of ammonia volatilization from spring wheat. Crop Sci. 29:726-731.
Olson, R.V., L.S. Murphy, H.C. Moser, and C.W. Swallow. 1979. Fate of tagged fertilizer nitrogen applied to winter wheat. Soil Sci. Am. J. 43:973-975.
Olson, R.V. and C.W. Swallow. 1984. Fate of labeled nitrogen fertilizer applied to winter wheat for five years. Soil Sci. Soc. Am. J. 48:583-586.
Rasmussen, P.E., and C.R. Rohde. 1991. Tillage, soil depth, and precipitation effects on wheat response to nitrogen. Soil Sci. Soc. Am. J. 55:121-124.
Raun, W.R., and G.V. Johnson. 1995. Soil-plant buffering of inorganic nitrogen in continuous winter wheat. Agron. J. 87:827-834.
Reddy, G.B. and K.R. Reddy. 1993. Fate of nitrogen-15 enriched ammonium nitrate applied to corn. Soil Soc. Am. J. 57:111-115.
SAS Institute Inc. 1985. SAS procedures guide for personal computers. 6th ed. SAS Institute Inc., Cary, NC, USA.
Schepers, J.S., D.D. Francis, and M.T. Thompson. 1989. Simultaneous determination of total C, total N, and 15N on soil and plant material. Commun. in Soil. Sci. Plant Anal. 20(9&10):949-959.
Stutte, C.A., R.T. Weiland, A.R. Blem. 1979. Gaseous nitrogen loss from soybean foliage. Agron. J. 71:95-97.
Webster, C.P. R.K. Belford, and R.Q. Cannell. 1986. Crop uptake and leaching losses of 15N labelled fertilizer nitrogen in relation to waterlogging of clay and sandy loam soils. Plant and Soil 92:89-101.
TABLE 1. Treatments and surface soil test characteristics (0-15 cm) for experiments 222 and 502.
|
Exp. |
Fertilizer Applied |
Soil Test Level |
||||||
|
|
N |
P |
K |
pH |
P |
K |
Organic C |
Total N |
|
|
|
|
|
|
|
|
|
|
|
|
----------kg ha-1 yr-1--------- |
|
mg kg-1 |
mg kg-1 |
g kg-1 |
g kg-1 |
||
|
222 |
0 |
29 |
38 |
6.0 |
57 |
221 |
8.2 |
0.6 |
|
|
45 |
29 |
38 |
5.7 |
65 |
283 |
8.9 |
0.7 |
|
|
90 |
29 |
38 |
5.4 |
57 |
253 |
9.8 |
0.8 |
|
|
135 |
29 |
38 |
5.2 |
56 |
220 |
9.7 |
0.8 |
|
|
|
|
|
|
|
|
|
|
|
502 |
0 |
20 |
56 |
5.7 |
57 |
417 |
4.6 |
0.9 |
|
|
23 |
20 |
56 |
5.7 |
50 |
373 |
5.1 |
0.9 |
|
|
45 |
20 |
56 |
5.6 |
65 |
409 |
4.3 |
0.7 |
|
|
67 |
20 |
56 |
5.5 |
58 |
389 |
4.5 |
0.9 |
|
|
90 |
20 |
56 |
5.4 |
52 |
426 |
4.3 |
0.7 |
|
|
112 |
20 |
56 |
5.3 |
55 |
455 |
5.1 |
0.9 |
|
|
|
|
|
|
|
|
|
|
pH, 1:1 soil:water, K and P, Mehlich III; Organic C (carbon) and Total N, dry combustion
TABLE 2. Grain yield from Experiment 222, 1995-1997 and Experiment 502, 1996-1997
|
Experiment |
Fertilizer Applied |
Grain Yield |
||
|
|
N |
1996 |
1997 |
|
|
|
kg ha-1 yr-1 |
--------kg ha-1--------- |
||
|
222 |
0 |
815.90 |
942.85 |
|
|
|
45 |
1006.18 |
888.32 |
|
|
|
90 |
1139.69 |
1135.40 |
|
|
|
135 |
1235.64 |
1927.44 |
|
|
SED |
62.96 |
128.10 |
||
|
N rate linear |
*** |
*** |
||
|
N rate quadratic |
ns |
** |
||
|
|
|
|
|
|
|
502 |
0 |
|
1342.39 |
|
|
|
23 |
|
1969.17 |
|
|
|
45 |
|
2271.61 |
|
|
|
67 |
|
2590.99 |
|
|
|
90 |
|
3169.02 |
|
|
|
112 |
|
4009.41 |
|
|
SED |
|
582.33 |
||
|
N rate linear |
|
*** |
||
|
|
ns |
|||
*, **, *** Significant at the 0.05, 0.01, and 0.001 probability levels, respectively.
SED = standard error of the difference between two equally replicated treatment means.
TABLE 3. Forage, grain and straw N uptake and estimated plant N loss, experiments 222, 1996-1997, and 502, 1997
|
Location |
|
Total N Uptake |
|||||||||
|
|
|
-------------------1996------------------ |
-------------------1997------------------- |
|
|||||||
|
|
Applied N |
Forage |
Grain |
Straw |
Gain/ Lossx |
Forage |
Grain |
Straw |
Gain/ Lossx |
|
|
|
|
kg ha-1 yr-1 |
--------------------------kg N ha-1------------------------- |
|||||||||
|
222 |
0 |
29.40 |
23.47 |
12.74 |
+6.81 |
18.76 |
22.54 |
8.04 |
+11.82 |
|
|
|
|
45 |
38.59 |
32.10 |
18.54 |
+12.05 |
42.81 |
23.13 |
21.43 |
+1.75 |
|
|
|
|
90 |
70.72 |
40.63 |
27.50 |
-2.59 |
96.62 |
31.01 |
55.02 |
+6.32 |
|
|
|
|
135 |
102.49 |
48.41 |
39.41 |
-14.67 |
143.61 |
51.69 |
71.93 |
-5.1 |
|
|
|
SED |
8.20 |
4.40 |
2.79 |
|
19.91 |
2.90 |
11.91 |
|
|
||
|
N rate linear |
*** |
** |
*** |
|
** |
*** |
** |
|
|
||
|
N rate quadratic |
ns |
ns |
ns |
|
ns |
** |
ns |
|
|
||
|
|
|
|
|
|
|
|
|
|
|
|
|
|
502 |
0 |
|
|
|
|
29.46 |
32.83 |
11.08 |
+14.45 |
|
|
|
|
23 |
|
|
|
|
56.21 |
50.01 |
26.68 |
+20.48 |
|
|
|
|
45 |
|
|
|
|
127.96 |
57.05 |
47.54 |
-23.37 |
|
|
|
|
67 |
|
|
|
|
132.12 |
63.56 |
40.15 |
-28.41 |
|
|
|
|
90 |
|
|
|
|
182.29 |
90.54 |
63.05 |
-28.70 |
|
|
|
|
112 |
|
|
|
|
191.84 |
105.39 |
44.90 |
-41.55 |
|
|
|
SED |
|
|
|
24.79 |
14.65 |
9.55 |
|
|
|||
|
N rate linear |
|
|
|
*** |
*** |
*** |
|
|
|||
|
N rate quadratic |
|
|
|
ns |
ns |
* |
|
|
|||
xGain/loss
determined by subtracting forage N uptake at flowering from total N in the grain
and straw at maturity
(+ values indicate a net gain and - values indicate a net loss from flowering to
maturity).
*, **, *** significant at the 0.05, 0.01, and 0.001 probability levels, respectively.
SED = standard error of the difference between two equally replicated treatment means.
TABLE 4. Percent
fertilizer recovery and estimated plant N loss using the isotope method,
experiments 222,
1996-1997, and 502, 1997
|
Location |
|
Fertilizer N Recovery |
||||||||
|
|
|
1996 |
1997 |
|
||||||
|
|
Applied N |
Forage |
Grain |
Straw |
Gain/ Lossx |
Forage |
Grain |
Straw |
Gain/ Loss/x |
|
|
|
kg ha-1 yr-1 |
-----------------------------------------------%------------------------------------------- |
||||||||
|
222 |
0 |
- |
- |
- |
|
- |
- |
- |
- |
|
|
|
45 |
19.43 |
12.89 |
5.85 |
-0.69 |
1.27 |
0.70 |
0.56 |
-0.01 |
|
|
|
90 |
21.51 |
9.71 |
4.55 |
-7.25 |
3.24 |
1.07 |
1.87 |
-0.30 |
|
|
|
135 |
25.68 |
12.04 |
3.49 |
-10.15 |
3.35 |
1.23 |
1.84 |
-0.28 |
|
|
SED |
4.17 |
2.06 |
0.78 |
|
0.46 |
0.27 |
0.59 |
|
||
|
N rate linear |
ns |
ns |
* |
|
* |
ns |
ns |
|
||
|
N rate quadratic |
ns |
ns |
ns |
|
ns |
ns |
ns |
|
||
|
|
|
|
|
|
|
|
|
|
|
|
|
502 |
0 |
|
|
|
|
- |
- |
- |
- |
|
|
|
23 |
|
|
|
|
17.41 |
11.72 |
7.39 |
+1.7 |
|
|
|
45 |
|
|
|
|
24.69 |
9.56 |
9.77 |
-5.36 |
|
|
|
67 |
|
|
|
|
28.11 |
11.99 |
7.62 |
-8.5 |
|
|
|
90 |
|
|
|
|
27.19 |
10.59 |
7.36 |
-9.24 |
|
|
|
112 |
|
|
|
|
25.52 |
12.32 |
5.26 |
-7.94 |
|
|
SED |
|
|
|
3.82 |
2.43 |
2.79 |
|
|
||
|
N rate linear |
|
|
|
ns |
ns |
ns |
|
|
||
|
N rate quadratic |
|
|
|
ns |
ns |
ns |
|
|
||
xGain/Loss
determined by subtracting forage N uptake at flowering from total N in the grain
and straw at maturity
(+ values indicate a net gain and - values indicate a net loss from flowering to
maturity).
*, **, *** significant at the 0.05, 0.01, and 0.001 probability levels, respectively.
SED = standard error of the difference between two equally replicated treatment means.
TABLE
5. Fertilizer N recovery at the end of two years, in the grain,
straw and soil for experiments 222 and 502, 1996-97, isotope method.
|
Experiment |
|
Fertilizer N Recovery |
|||
|
|
|
|
1997 |
|
|
|
|
Applied N |
Grain + Straw (2yrs) |
Soil |
Total† |
|
|
|
kg ha-1 yr-1 |
-------------- % ------------- |
|||
|
222 |
0 |
- |
- |
- |
|
|
|
45 |
20.0 |
66.02 |
86.02 |
|
|
|
90 |
17.2 |
34.70 |
51.9 |
|
|
|
135 |
18.6 |
25.04 |
43.64 |
|
|
SED |
|
14.95 |
|
||
|
N rate linear |
|
* |
|
||
|
N rate quadratic |
|
ns |
|
||
|
|
|
|
|
|
|
|
502 |
0 |
- |
- |
- |
|
|
|
23 |
19.11 |
42.21 |
61.32 |
|
|
|
45 |
19.33 |
41.15 |
60.48 |
|
|
|
67 |
19.61 |
24.58 |
44.19 |
|
|
|
90 |
17.95 |
22.48 |
40.43 |
|
|
|
112 |
17.58 |
20.96 |
38.54 |
|
|
SED |
|
6.76 |
|
||
|
N rate linear |
|
* |
|
||
|
N rate quadratic |
|
ns |
|
||
*, **, *** significant at the 0.05, 0.01, and 0.001 probability levels, respectively.
SED = standard error of the difference between two equally replicated treatment means.
† Total recovery, grain and straw (1996 &1997) and that recovered in the soil
FIGURE 1. Fertilizer N recovery in the soil by depth and N rate, Experiment 222, 1996 and 1997 (SED - standard error of the difference between two equally replicated means).
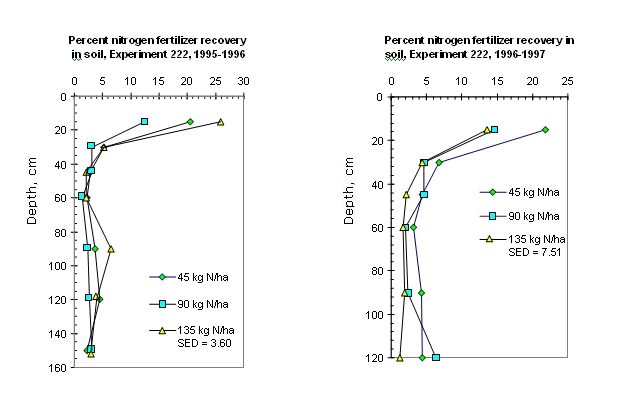
FIGURE 2. Fertilizer N recovery in the soil by depth and N rate, Experiment 502, 1997 (SED - standard error of the difference between two equally replicated means)
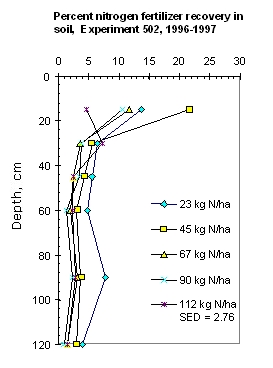
FIGURE 3. Ratio of NO3 to NH4 versus estimated plant N loss for experiments 222, 1996-1997, and 502, 1997