Summary
· From 1994 to 2004, AN treatments at the same N rate resulted in significantly greater grain yields when compared to biosolids treatments.
· Poor stand and weed pressure adversely affected yields in 1995 and 1996
· In 5 of 11 years applying 160 lb N/ac resulted in increased yields compared to 80 lb/ac
· RINDVI predicted RIHARVEST in 3 of 6 years, underestimating in the other 3
References
Gavi, F., W.R. Raun, N.T. Basta, and G.V. Johnson. 1997. Effect of sewage sludge and ammonium nitrate on wheat yield and soil profile inorganic nitrogen accumulation. J. Plant Nutr. 20 (2&3): 203-218.
Mullen, R. W., W.R. Raun, N.T. Basta, J.L. Schroder, and K.W. Freeman. 2004. Effect of long-term application of biosolids on molybdenum content and quality of winter wheat forage. J. Plant Nutr. (in press).
Abstract
Environmentally sound management practices for sewage sludge in grain crop production systems are becoming increasingly important. The objectives of this study were to compare N rates of sewage sludge and ammonium nitrate on yield and heavy metal uptake in winter wheat (Triticum aestivum L.). One field experiment was established in 1993 that evaluated six N rates (0 to 538 kg ha-1 yr-1) as dry anaerobically digested sewage sludge and ammonium nitrate. Lime application in 1993 (8.96 Mg ha-1), 1999 (8.96 Mg ha-1) and 2000 (12.99 Mg ha-1) was also evaluated. In general, wheat yields peaked at the 180 kg N ha-1 rate when N was applied as either sewage sludge or ammonium nitrate. However, wheat grain yields were significantly higher using ammonium nitrate when compared to sewage sludge at comparable rates. Averaged over this seven year period, ammonium nitrate treatments resulted in 28.1 bu/ac (1.9 Mg/ha) while sewage sludge resulted in 20.2 bu/ac (1.4 Mg/ha)(both averaged over N rates). Fertilizer N immobilization was expected to be high in the first few years since this site was previously in native bermudagrass (Cynodon dactylon L.). Following 2-3 years of applying sewage sludge, we expected to achieve the same yields at comparable rates as that using ammonium nitrate. Because ammonium nitrate treatments continue to produce significantly higher yields (following 7 years) when compared to sewage sludge, either N mineralization rates are markedly lower than that previously thought (21% for sewage sludge), or the soil-plant system has yet to achieve equilibrium. Molybdenum concentrations in wheat forage at Feekes growth stage 4 were significantly higher in sewage sludge treated plots when compared to ammonium nitrate. Alternatively, Cu and Fe levels did not differ in wheat forage as a function of N source (sewage sludge versus ammonium nitrate). The Cu to Mo ratio in the wheat forage was above 2 for all treatments. When Cu:Mo ratios are less than 2 in wheat forage, cattle can develop Cu deficiencies. When lime was applied, forage Mo levels were dramatically higher for sewage sludge plots as compared to ammonium nitrate.
Table 1. Treatment structure and grain yield means (kg/ha), 1994-2004, Stillwater, OK.
|
TRT |
Source |
N-rate |
1994 |
1995 |
1996 |
1997 |
1998 |
1999 |
2000 |
2001 |
2002 |
2003 |
2004 |
Mean |
|
1 |
ck |
0 |
464 |
499 |
613 |
1128 |
1934 |
908 |
924 |
1246 |
1677 |
1621 |
2157 |
1197 |
|
2 |
ck |
0 |
378 |
520 |
575 |
1288 |
1611 |
903 |
975 |
1075 |
834 |
1505 |
1888 |
1050 |
|
3 |
ss |
40 |
527 |
571 |
728 |
1558 |
2379 |
948 |
1310 |
1685 |
1753 |
2357 |
2921 |
1522 |
|
4 |
ss |
80 |
617 |
574 |
657 |
1515 |
2243 |
1069 |
1498 |
1574 |
2056 |
2398 |
3033 |
1567 |
|
5 |
ss |
160 |
886 |
569 |
1234 |
1400 |
3050 |
1362 |
1576 |
1982 |
1972 |
2754 |
3426 |
1846 |
|
6 |
ss |
240 |
1038 |
611 |
919 |
1390 |
2832 |
965 |
1234 |
1778 |
1871 |
1505 |
3734 |
1637 |
|
7 |
ss |
480 |
1505 |
1027 |
822 |
1458 |
3604 |
1834 |
1923 |
1542 |
1972 |
2622 |
3651 |
1996 |
|
8 |
an |
40 |
1782 |
620 |
339 |
1369 |
2055 |
904 |
1719 |
1387 |
1905 |
1662 |
2530 |
1479 |
|
9 |
an |
80 |
1739 |
906 |
512 |
1763 |
2863 |
1608 |
2887 |
1843 |
2731 |
3581 |
3818 |
2205 |
|
10 |
an |
160 |
1921 |
1196 |
666 |
2177 |
3442 |
2369 |
3304 |
2271 |
2596 |
4342 |
4260 |
2595 |
|
11 |
an |
240 |
2589 |
1419 |
536 |
2351 |
3041 |
2890 |
2785 |
1627 |
1551 |
3382 |
3382 |
2323 |
|
12 |
an |
480 |
2337 |
1282 |
557 |
2557 |
3106 |
2477 |
2052 |
1791 |
1728 |
2936 |
3416 |
2204 |
|
13 |
ssl |
480 |
1669 |
1052 |
880 |
1630 |
3730 |
2602 |
1569 |
1987 |
2225 |
3366 |
4515 |
2293 |
|
14 |
anl |
480 |
2187 |
1326 |
782 |
2843 |
3711 |
2860 |
2212 |
1825 |
2115 |
4466 |
4822 |
2650 |
|
|
Mean |
|
1442 |
944 |
788 |
1745 |
2829 |
1693 |
1877 |
1687 |
1928 |
2750 |
3397 |
1897 |
|
|
SS |
|
914 |
670 |
872 |
1464 |
2822 |
1236 |
1508 |
1712 |
1925 |
2327 |
3353 |
1714 |
|
|
AN |
|
2073 |
1085 |
522 |
2044 |
2901 |
2050 |
2549 |
1784 |
2102 |
3181 |
3481 |
2161 |
|
|
|
|
1159 |
414 |
-350 |
579 |
80 |
814 |
1041 |
71 |
177 |
853 |
128 |
447 |
L -
lime applied at a rate of 8960 kg/ha (4 tons/acre) in the fall of 1993
L – lime applied at a rate of 8960 kg/ha (4 tons/acre) in the fall of 1999
(87% ECCE)
L - lime applied at a rate of 12,992 kg/ha (5.8 tons/acre) in the fall of
2000 (85% ECCE)
SS - sewage sludge obtained from the City of Stillwater
AN - ammonium nitrate (34-0-0)
SED - standard error of the difference between two equally replicated
means
CV - coefficient of variation, %
Table
2. Total nitrogen and moisture
content of Stillwater sewage sludge, 1993 to 2000.
|
1993 |
1994 |
1995 |
1996 |
1997 |
1998 |
1999
|
2000 |
Avg. |
|
Total
N, % |
||||||||
|
2.02 |
1.74 |
1.97 |
2.73 |
2.42 |
2.43 |
2.02 |
2.44
|
2.22 |
|
Moisture,
% |
||||||||
|
60 |
35 |
59 |
na |
55 |
46 |
45 |
17 |
45 |
-
From 1994 to 1997, AN treatments at the same N rate resulted in significantly greater grain yields when compared to sewage sludge.
-
Poor stand and weed pressure adversely affected yields in 1996
-
By 1998, no differences in grain yield could be detected between AN and SS treatments
-
In 1999, SS treatments had significantly lower yields when compared to the same N rates using AN
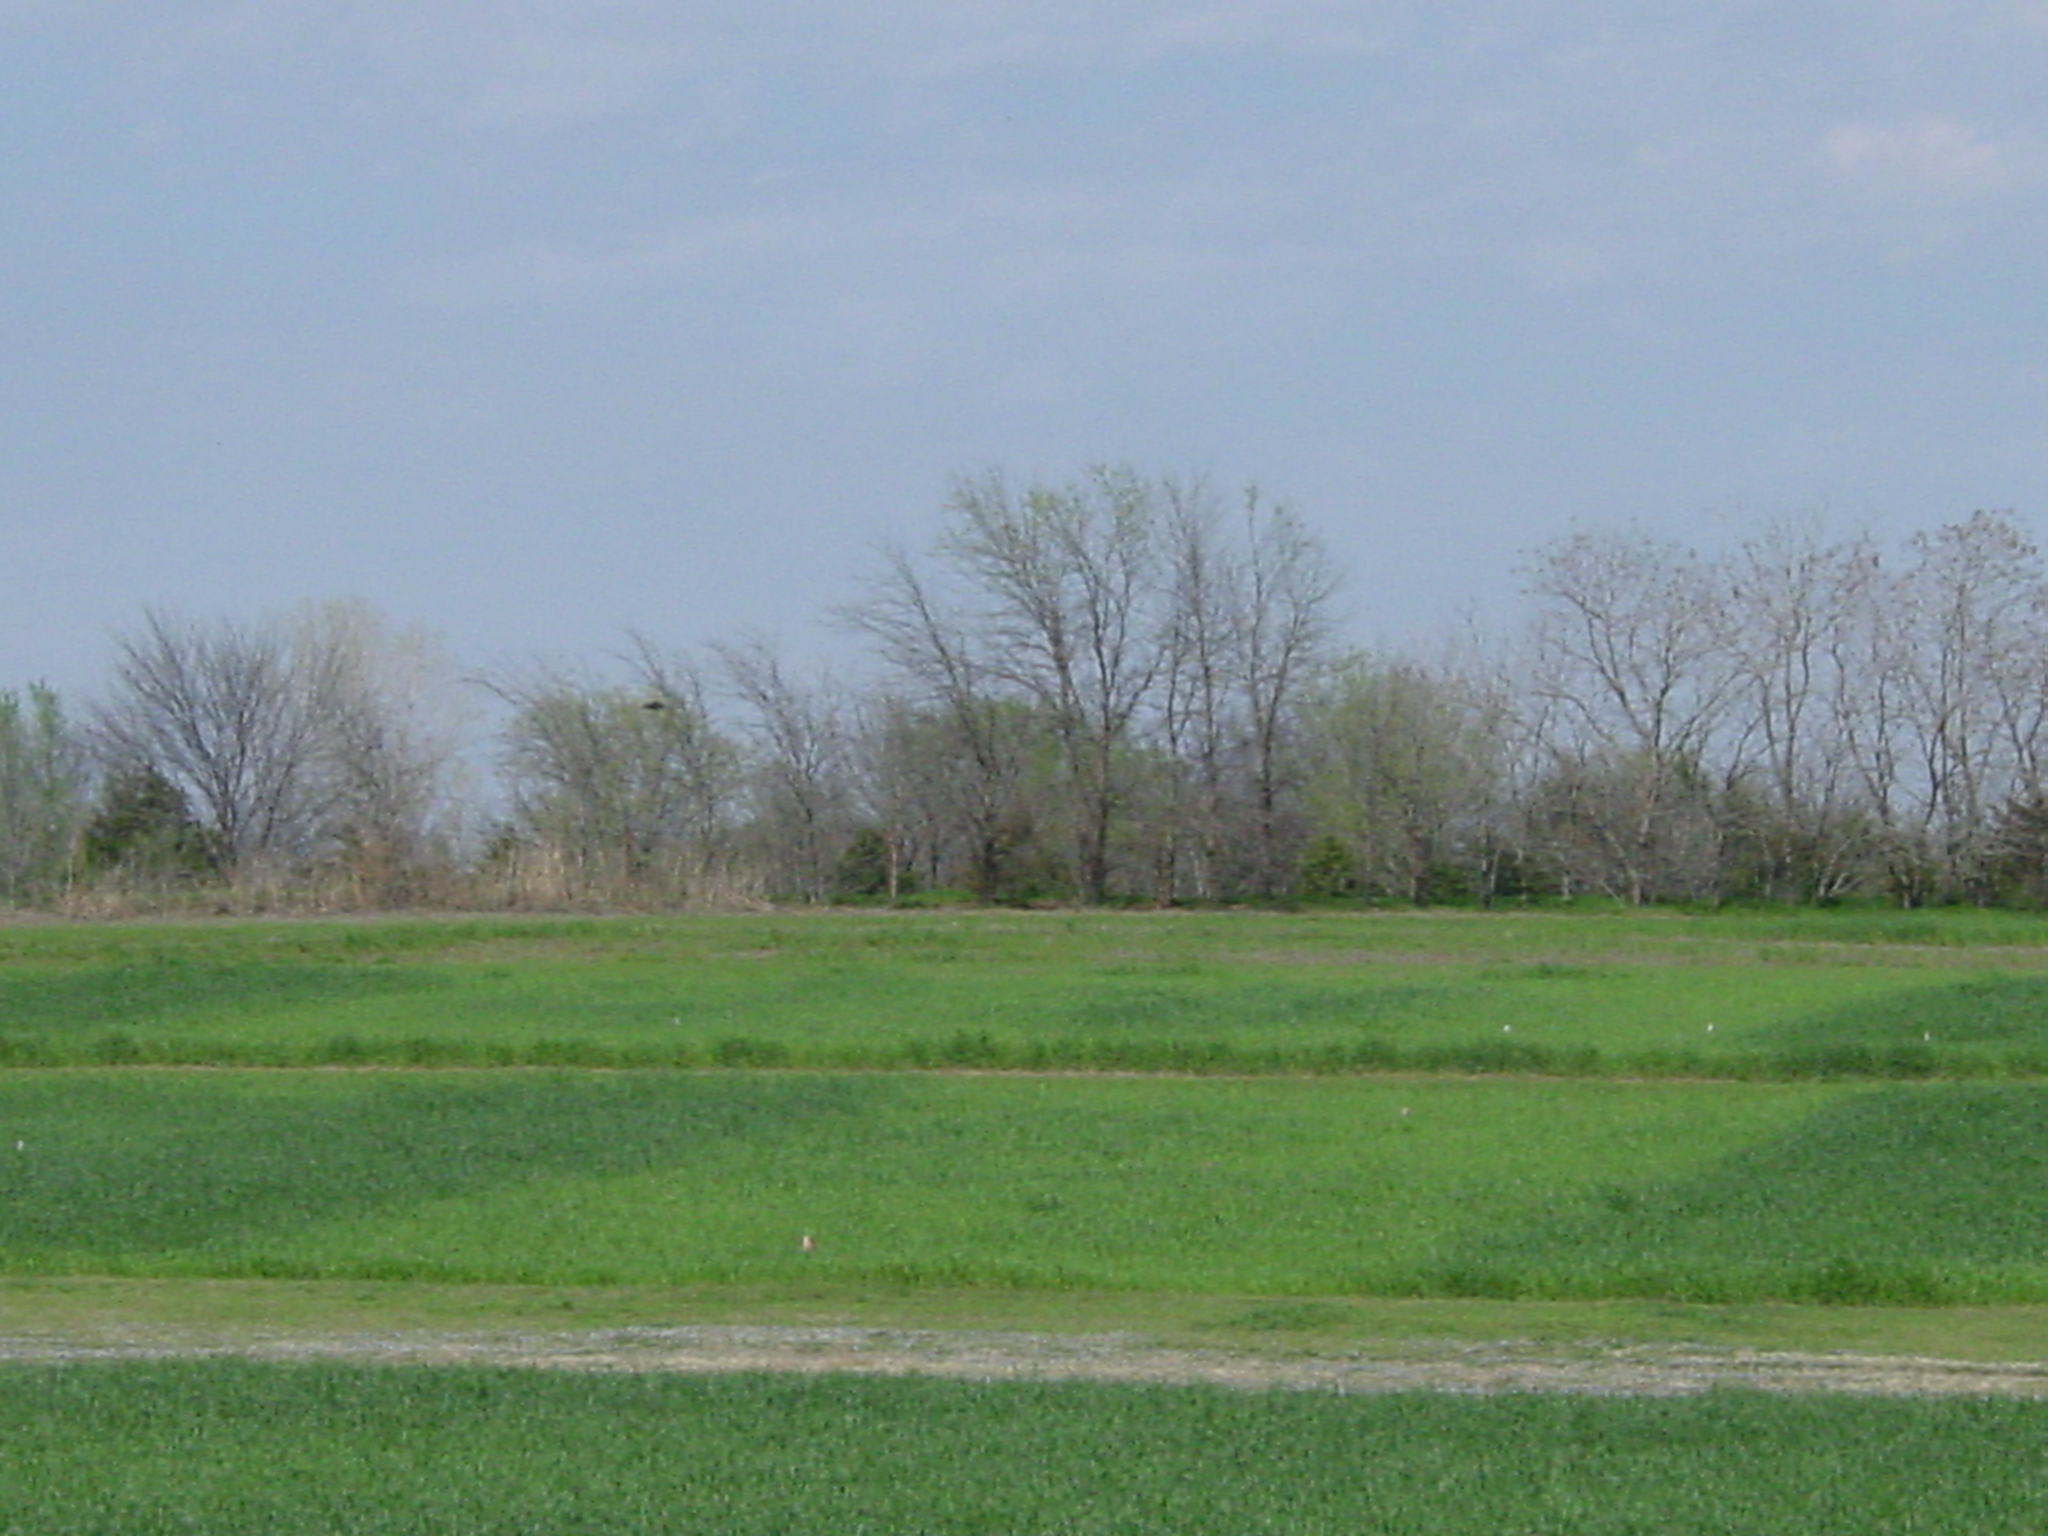
Annually applied biosolids, fall of 1993 to 2002, Efaw Experiment Station, Stillwater, OK 2002.
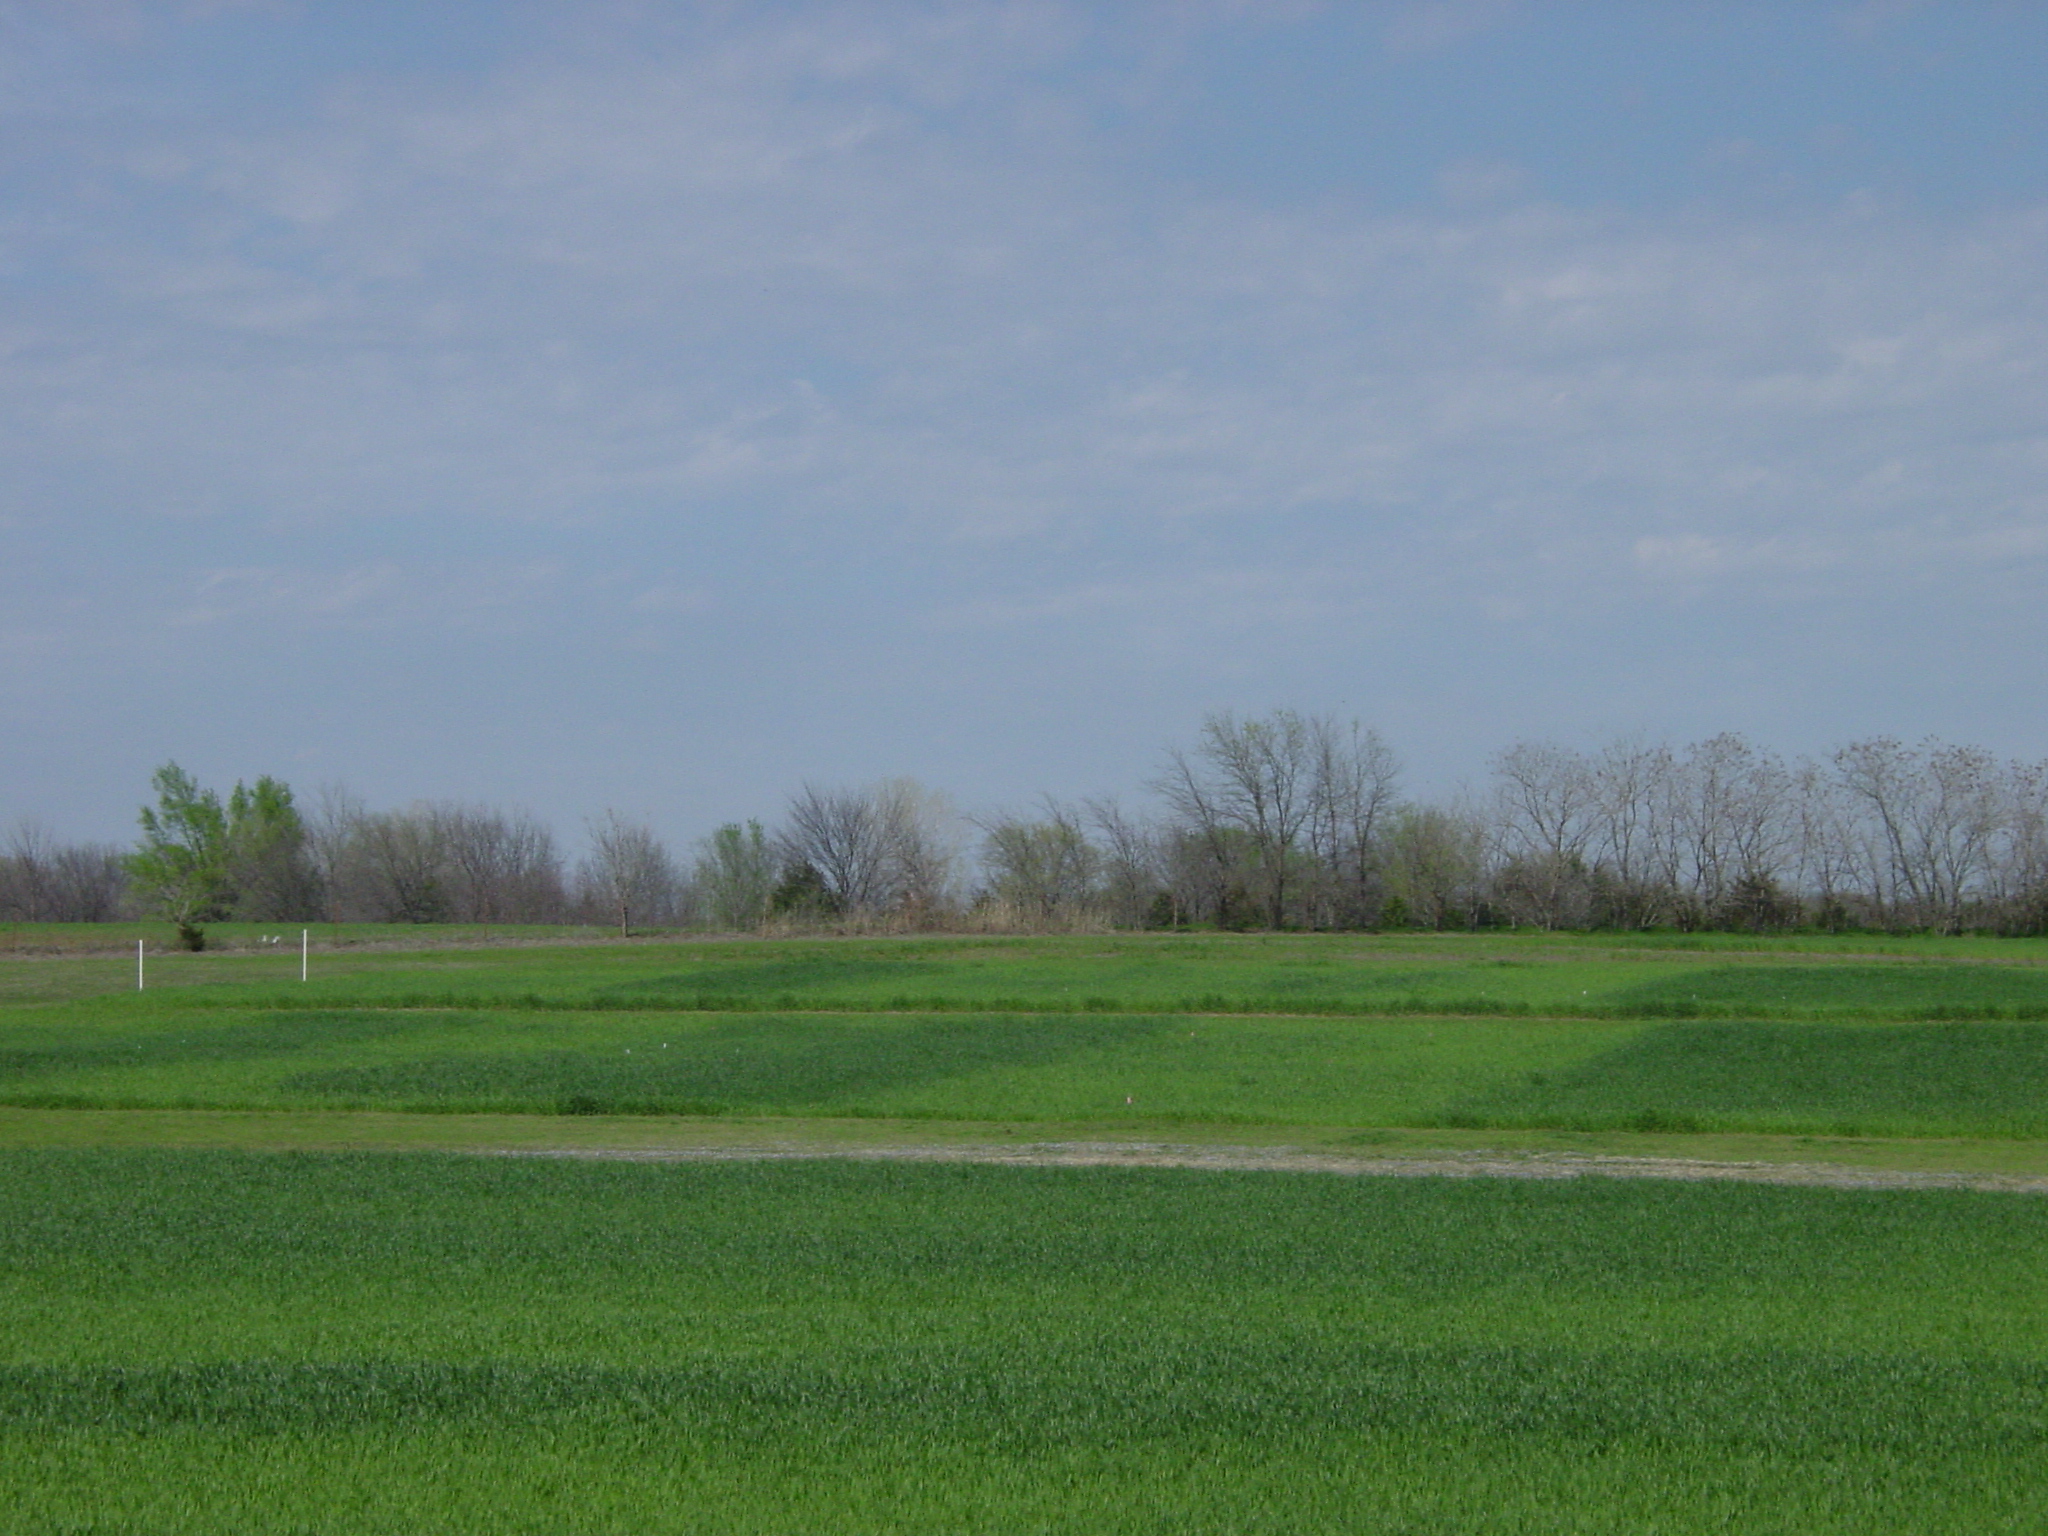
Annually applied biosolids, fall of 1993 to 2002, Efaw Experiment Station, Stillwater, OK 2002.
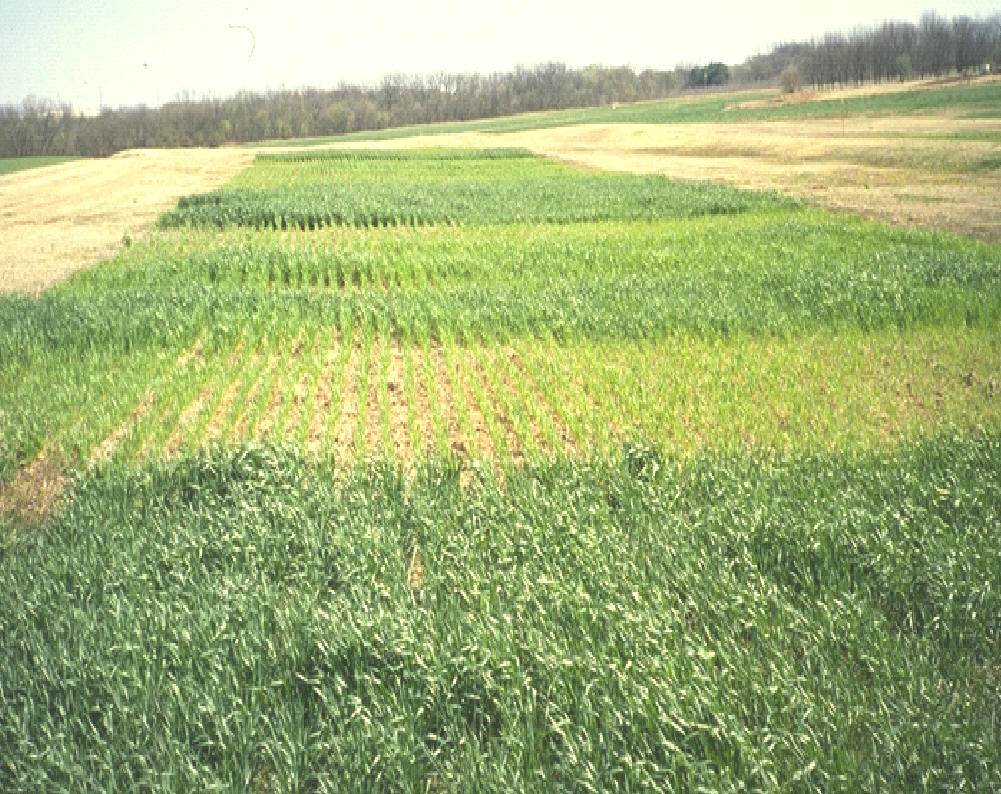
Annually applied biosolids, picture taken in the spring of 1996, Efaw Experiment Station, Stillwater, OK 2002.