 Mead,
NE RC Experiment (1983-1969), Conducted by Professor Robert A. Olson
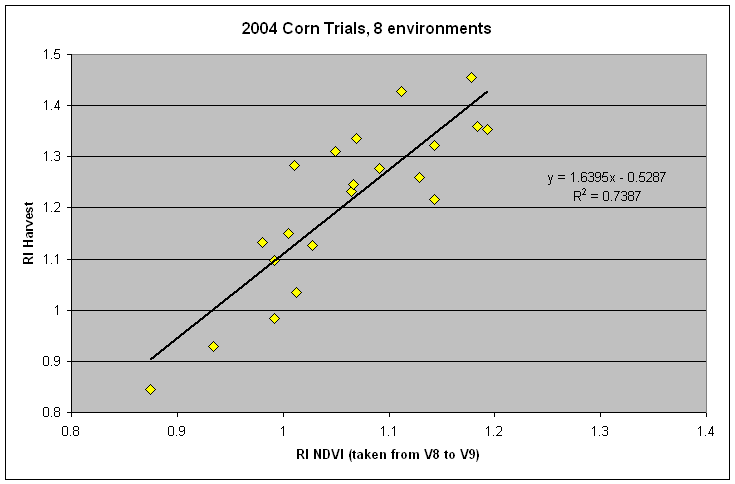
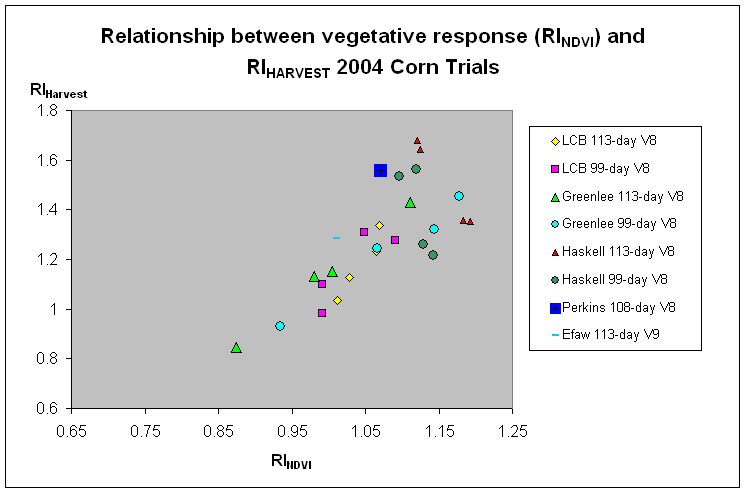
Relationship between the estimated responsiveness to applied N or response index (RI-NDVI) from sensor readings (RI-NDVI = NDVI in the N Rich strip divided by the NDVI in the farmer practice) and the response index determined at harvest (Grain yield in the N rich strip plot divided by the N Rich strip in the farmer practice), 2004 Corn Trials. The responsiveness to N can be determined from mid-season sensor measurements collected between V8 and V9.
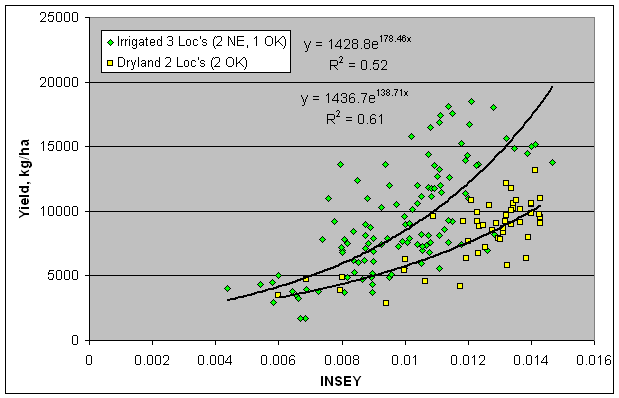
Relationship between INSEY (NDVI divided by the # of days from planting to sensing) collected at V8, and final corn grain yield.
_files/mead.jpg)
Corn grain yields in the check (0 kg N/ha) and the N adequate or N rich (180 kg N/ha) plots, and the associated response index (grain yield N rich, divided by the grain yield in the check) from 1969 to 1983 in the RC-RS long-term corn experiment conducted by Professor R.A. Olson near Mead, Nebraska.
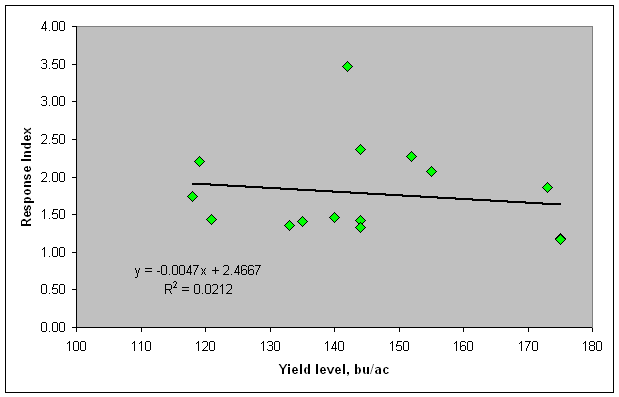
Yield level (180 lb N/ac) versus the response index (yield at 180 kg N/ha divided by yield at 0 kg N/ha), Mead, NE 1969-83
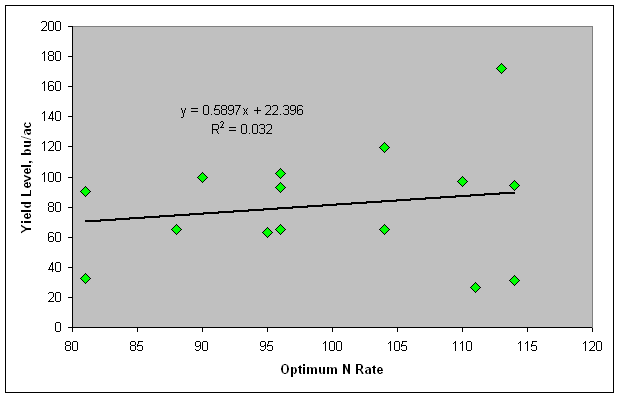
Optimum N rate (N uptake max yield minus N uptake check, divided by .5) versus yield level, 180 kg N/ha, Mead, NE, 1969-83.
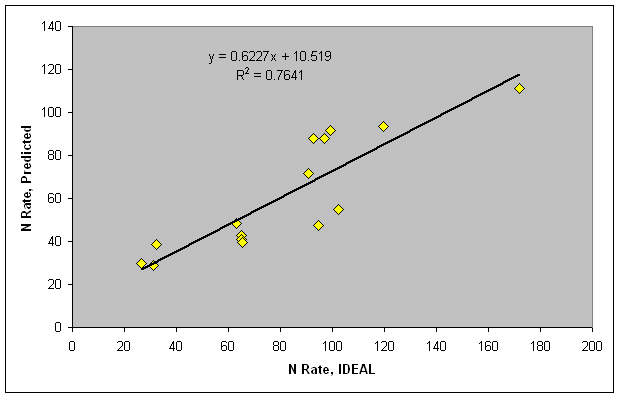
| N Rate, lb/ac | State | N Rate, lb/ac | 60% NUE | |||||||||||||
| Year | 0 | 90 | 180 | 270 | LSD | NE Avg. | RI | 0 | 90 | 180 | 270 | Added GN | N Rate | Added N | ||
| Grain yield, bu/ac | Grain N uptake, lb/ac | Uptake | Computed | Predicted | Difference | |||||||||||
| 1969 | 148 | 167 | 175 | 164 | 6.3 | 94 | 1.18 | 98 | 104 | 111 | 105 | 13 | 22 | 30 | 8 | |
| 1970 | 98 | 127 | 133 | 140 | 4.3 | 76 | 1.36 | 65 | 72 | 81 | 88 | 16 | 27 | 39 | 11 | |
| 1971 | 101 | 154 | 144 | 163 | 3.3 | 85 | 1.43 | 67 | 118 | 114 | 132 | 47 | 79 | 47 | 31 | |
| 1972 | 67 | 142 | 152 | 159 | 9.9 | 104 | 2.27 | 44 | 89 | 104 | 113 | 60 | 100 | 94 | 6 | |
| 1973 | 96 | 131 | 140 | 137 | 4.6 | 94 | 1.46 | 63 | 87 | 95 | 99 | 32 | 53 | 48 | 4 | |
| 1974 | 68 | 108 | 118 | 118 | 10.3 | 70 | 1.74 | 45 | 88 | 96 | 96 | 51 | 85 | 55 | 30 | |
| 1975 | 41 | 131 | 142 | 138 | 7.6 | 85 | 3.46 | 27 | 99 | 113 | 113 | 86 | 143 | 111 | 32 | |
| 1976 | 96 | 139 | 135 | 145 | 6.1 | 85 | 1.41 | 63 | 98 | 96 | 112 | 33 | 54 | 43 | 11 | |
| 1977 | 84 | 107 | 121 | 117 | 11.1 | 99 | 1.44 | 56 | 76 | 88 | 87 | 32 | 54 | 41 | 13 | |
| 1978 | 149 | 181 | 175 | 181 | 4.2 | 113 | 1.17 | 98 | 119 | 114 | 118 | 16 | 26 | 29 | 3 | |
| 1979 | 93 | 170 | 173 | 171 | 1.7 | 115 | 1.86 | 61 | 104 | 110 | 113 | 49 | 81 | 88 | 7 | |
| 1980 | 61 | 139 | 144 | 143 | 6.3 | 85 | 2.36 | 40 | 82 | 90 | 86 | 50 | 83 | 91 | 9 | |
| 1981 | 108 | 137 | 144 | 149 | 3.5 | 115 | 1.33 | 71 | 97 | 104 | 111 | 33 | 54 | 40 | 15 | |
| 1982 | 75 | 145 | 155 | 165 | 4 | 110 | 2.07 | 50 | 88 | 96 | 102 | 46 | 77 | 88 | 11 | |
| 1983 | 54 | 118 | 119 | 126 | 4.7 | 97 | 2.20 | 36 | 77 | 81 | 86 | 45 | 76 | 72 | 4 | |
| mean | 89.3 | 139.7 | 144.7 | 147.7 | 5.9 | 95.1 | 1.620612 | Mean | 41 | 68 | 61 | 13 | ||||
| CV | 0.34 | 0.15 | 0.13 | 0.13 | 0.47 | 0.15 | ||||||||||