
Replies from Biological Research, 1979
Need 2-4 years/locations/sites/trials
Need at least 3 replications
Need at least 10 treatments
Grain yield (yield value of any kind)
NDVI
OSU Long-Term Experiments
Experiment 502, Lahoma, Oklahoma
Experiment 222, Stillwater, Oklahoma
| STUDENT NAME | OSU E-MAIL | ||
| Alidekki, Daniel | ssajjadaniel@yahoo.com | Uganda | |
| Hand Planters for Africa | PPT file | ||
| DIAITE-KOUMBA, MAME FATOU SIBY | DIAITEK@OKSTATE.EDU | Senegal | |
| Drought and Poor Soil Fertilty in SSA | PPT file | ||
| DRIVER, ETHAN CHARLES | EDRIVER@OKSTATE.EDU | California | |
| Economic Impacts due to irrigation water reductions in the Sacramento Valley | |||
| ERVIN, LINDA SHAWNTEL | SHAWNTEL.ERVIN@OKSTATE.EDU | Oklahoma | |
| Getting N Rates Right | PPT File | ||
| JONES, JOHN W | BILL.JONES@OKSTATE.EDU | Oklahoma | |
| Optimizing Canola Winter Survivability | PPT File | ||
| LASQUITES, JAMES JADE SEBIAL | JAMESJADE.LASQUITES@OKSTATE.EDU | Philippines | |
| C4 Rice | |||
| MORANDIN FIGUEIREDO, BRUNO | BRUNOM@OKSTATE.EDU | Brazil | |
| Effect of Micronutrient Fertilizer | PPT File | ||
| GOLDEN, MELISSA RAE | MELISSA.GOLDEN@OKSTATE.EDU | Oklahoma | |
| Optimum Growth Window for NDVI Sensing | PPT File | ||
| RAMOS DEL CORSO, MARIANA | DELCORS@OKSTATE.EDU | Brazil | |
| Severe drought in Sau Paulo, Brazil | PPT File | ||
| Remondet, Nicole | remonde@okstate.edu | USA | |
| Reverse N Lookup, SBNRC | PPT File | ||
| ZOCA, SAMUEL MENEGATTI | SAMUEL.ZOCA@OKSTATE.EDU | Brazil | |
| In-Season Plant K Determination | |||
| WATKINS, PATRICK H | PATRICK.WATKINS@OKSTATE.EDU | USA | |
| Watkins Agricultural Services, LLC | |||
| DHILLON, JAGMANDEEP SINGH | JAGMAN.DHILLON@OKSTATE.EDU | India | |
| Use of Indicator Crops for Detecting Corn Deficiencies | |||
1. Shawntel Ervin (February 5, 2015)
2. MSE vs yield (February 26, 2015) (SAS file without CV)
3. Excel File MSE_Yield April 8, 2015
4. Class Publication (4/21/2015)
5. E502Check
6. Class project, program, 4/21/2015 (3D surface response)
Class PROJECT:
Objectives:
1. To determine the frequency for combining year to year data from long-term experiments
2. To determine the relationship between MSE and yield level
Literature Review: Need to partition sections
HOMEWORK #2
1. Run a 3D surface response model (502 and 222) for Mgha = year*CV (need regression output and graphic output). To do this you will need to compute CV, or retrieve it from our CLASS PROJECT FILE.
2. Provide a written interpretration for the results
Homework #3
1. Construct contrasts for the following comparisons using data from Experiment 502
a. N rate linear
b. N rate quadratic
c. High P rate (fixed N and K) versus 0P rate
d. High K rate (fixed N and P) versus 0K rate
Homework #4
a. Using our class data set, construct a linear plateau model for (222 and 502 individually) MSE (y) versus Yield (x)
b. report the "joint" and a functional equation (that would describe the model)
c. Was the R2 improved over that of a linear model? Why or why not?
Homework #5
Class project. Prepare on one sheet of paper, a project you hope to carry out, into the future. This is the same project as your presentation to the class. Items to help you include the abstract below and
ASA Abstract
Hand Planter 2015
http://www.ats.ucla.edu/stat/sas/library/GLMvsMIXED_os.htm
PROC GLM vs PROC MIXED
spring break (March 16-20)
March 24, March 26
March 31, April 2
April 7, April 9
April 14,
April 16, Daniel Alidekki, Mame Diate-Koumba, Ethan Driver
April 21, Shawntel Ervin, Bill Jones
April 23, James Lasquites, Bruno Figueiredo, Melissa Golden, Jagmandeep Dhillon
April 28, Nicole Remondet, Samuel Zoca, Patrick Watkins, Mariana Ramos Del Corso
April 30, FINAL Review
(Final Exam, Friday, May 1, 9-10:30am, Room 463)
FINAL EXAM: 2015
1. The "Experimental Method" (defined)
2. The "Scientific Method"
3. Formulation of hypotheses
3b. 15 Steps to Good Research (Georgetown)
3c. How to Have a Bad Career in Research
3d. Advice on Research and Writing (ASA abstract)
4. By-Plant Corn Studies
5. -When should I block, How should I block?
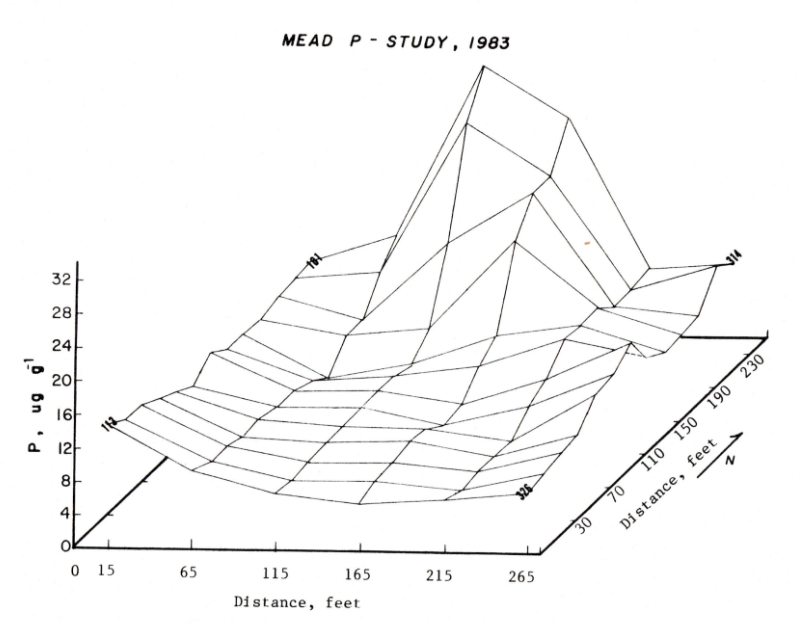
Mead, NE, initial soil test P levels
-RCBD vs CRD,
Coefficiants
for Orthogonal Contrasts (pdf sheet)
Checklist for
Troubleshooting Non-estimatable Contrasts
7. Covariance, Autocorrelation
Collecting Added Data: When is this useful?
Why collect Added
Data?
Who is the expert on your particular study?
Discussion
(Testing)
Univariate, Testing for a Normal
Distribution
Jana Disease Data
* * (non-parametric statistics, Proc Rank, Proc
Univariate)
New Algorithm 2007
8. Regression
Analysis
This page includes Linear
Plateau
Linear-Linear
Confidence Intervals about regression
Statility Analysis (several)
Slope and intercept differences
9. Applied Statistical Procedures
-regression versus ANOVA
-Cate-Nelson and Linear-Plateau
Mean Separation: Calculation of the SED and LSD
SED = square root (2*MSE/reps) = square root (2*s2/reps)
10. Special Topics
Jay Goos (N fertilizer products, discuss experimental design)
global warming from the animal industry
