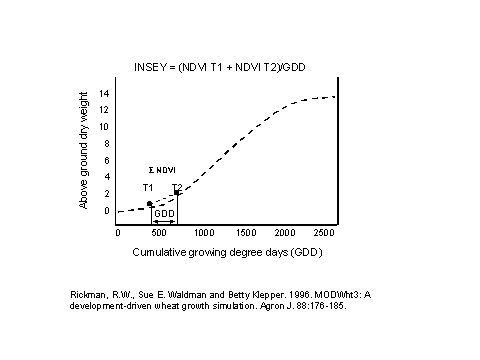
We assumed that growth from planting in October to the mid winter months of January and February would provide an excellent indicator of wheat health in each 0.84m2 area and thus the early-season growth-limiting conditions for small areas. The sum of NDVI at Time-1 and NDVI at Time-2, divided by growing degree days (GDD = [(Tmin + Tmax)/2 - 4.4°C] (from Time-1 to Time-2) was computed and evaluated as an index for in-season prediction of grain yield (in-season estimated yield, or INSEY ) The INSEY index was one of many different indices evaluated that included mathematical combinations of the following; NDVI at Time-1 and Time-2, GDD and total days from Time-1 to Time-2, GDD and total days from planting to Time-1, and GDD and total days from planting to Time-2. The INSEY value was expected to reflect a point on the potential growth curve for that season, thus providing a reliable estimate of YIELD POTENTIAL that was specific to the growing conditions from planting to dates of sensing. The use of GDD in the computation of INSEY allowed us to consider both winter-spring growing conditions and time (between the readings) and to a certain extent, rate of growth. This was also consistent with work by Rickman et al. (1996) showing the relationship between above ground dry weight and cumulative growing degree days (Figure above). Dividing the sum of NDVI at Time-1 and Time-2 by GDD results in a unit of predicted biomass (using NDVI) per growing degree day.
It is important to note that the sum and not the difference in NDVI from Time-1 to Time-2 was used since the sum would reflect the average, while the difference (NDVI at Time-2 minus NDVI at Time-1) would theoretically imply growth rate. Although we were interested in growth from Time-1 to Time-2, the difference in NDVI from Time-1 to Time-2 was not always consistent since some measurements resulted in negative values. This was a biological possibility in winter wheat; especially considering what can happen in terms of weather from January to February and its effect on wheat foliage. This is in addition to other factors affecting optical measurements enumerated by Huete (1987) and Jackson and Huete (1991). For this reason, the sum of NDVI at Time-1 and Time-2 was used and also because the initial prediction of biomass (Time-1) integrated growing conditions and plant health (stand density, vigor and N uptake) from planting until the first winter spectral reading. Also, adding the two NDVI readings (estimates of biomass) assisted in removing some of the variability in radiometric data collected from the same 1m2 area over time.
![]()