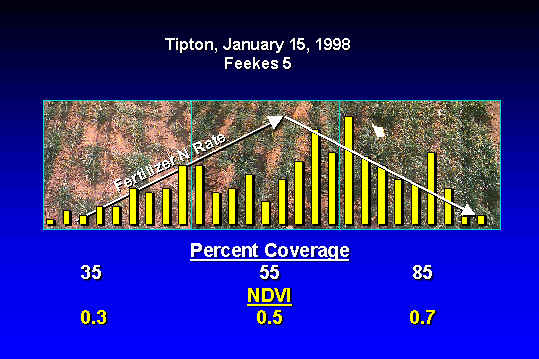
In the winter of 1998, spectral radiance measurements were taken between Feekes growth stages 4 and 5. At that time, we recognized that the biomass present in each plot was as much a function of plant stand as it was N fertilizer treatment. The figure on the left shows percent coverage ranging from 35% to 85% and associated NDVI values that parallel percent coverage. At early stages of growth the percent of soil covered by vegetation is closely related to total plant biomass. Therefore, NDVI can reliably predict both percent coverage and plant biomass at these stages of growth.
Wheat in the left box would likely have a lower yield potential compared to wheat in the two right boxes, a result of a poor plant stand. Because of this, applied fertilizer N rates would be lower based on lower yield potential and lower yield goal. In the two boxes on the right, yield potential would likely be the same, but where wheat in the middle box should theoretically require more N than that on the right to achieve the same yield.
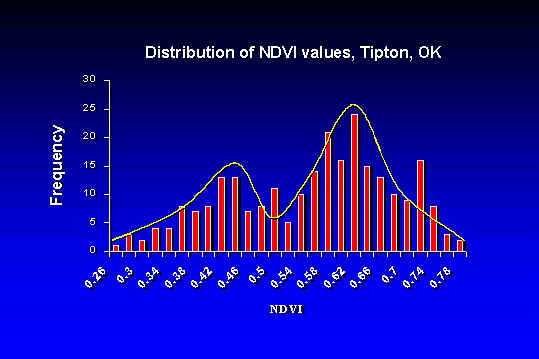
When evaluating whether or not NDVI values were normally distributed, we found a bi-modal distribution. NDVI values within 0.26 to 0.5 were those where plant stand was a problem and values in excess of 0.5 had good stands but where N was limiting growth. For the distribution on the left, a different N management strategy would be required than that on the right. If yield potential was completely restricted by a poor plant stand, topdress N would have little impact on resultant yield. Therefore, no fertilizer N would be applied to these plots. As plant stand became less and less of a problem, applied N rates would increase to the point where plant stand was no longer a variable. From the point where plant stands were all adequate but where biomass was largely variable due to limiting N, fertilizer N would be applied at the highest N rate (middle box), decreasing linearly to 0 where no yield response to added N fertilizer (right box) would be expected.
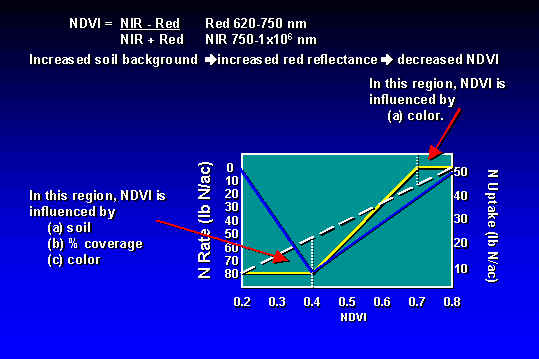
Increasing N rates based on plant stand (blue line, NDVI from 0.2 to 0.4) and decreasing N rates based on biomass (blue line, NDVI > 0.4) is unique. This is an example of using a sensor based technology to determine the difference between yield potential as a function of one variable while simultaneously evaluating yield potential as a function of another. The next step in the process is to assure the sensor-based detection of biomass and plant stand independent of one another and to recognize when they interact.
If plant stand were not a problem, a plateau-linear-plateau model would likely be employed to establish N rates (yellow line). Maximum N rates could be required across a range of NDVI values less than 0.4 assuming that percent coverage was a function of limiting N. Simlarly, NDVI values in excess of 0.7 may all fit into to the category of luxury consumption and where this range received no added topdress N fertilizer.
Combining both management resolution and interacting variables which influence yield potential, we believe that NUE can be increased significantly. Recent results from our resolution experiments can be found by following the hyperlink below.
![]()