
1. Mark 10, 4m2 areas in 10 different
fields
2. Record planting date
3. Collect mid-season sensor readings (F4 to F6 in wheat, V8 to V12 in
corn) and record date
4. On these 100 plots, no N fertilizer can be applied mid-season, or
anytime after sensor readings are collected
5. Collect grain yield from all 100 plots
6. Determine INSEY (NDVI divided by the days from planting to sensing)
7. Establish relationship between INSEY and collected grain yield.
8. Equation in 7 can be used within the
SBNRC to
determine fertilizer N rates
Algorithm covered under the following patents
1.
Raun, W.R., G.V. Johnson, J.B. Solie, and M.L. Stone. 2003.
Process for in-season fertilizer nitrogen application based on predicted
yield potential. US Patent No. 6,601,341 B2. Issued, August 5, 2003.
2. Stone, M.L., D. Needham, J.B. Solie, W.R. Raun, and G.V. Johnson. 2003. Optical spectral reflectance sensor and controller. US Patent No. 6,596,996 B1, Issued July 22, 2003.
3.
Raun, W.R., G.V. Johnson, J.B. Solie, and M.L. Stone. 2004. A
process for in-season fertilizer nitrogen application based on predicted
yield potential. U.S. Patent. 10,195,138. (CIP of U.S. Patent
6,601,341).
4.
Raun, W.R.,
G.V. Johnson, J.B. Solie, and M.L. Stone. April 19, 2005. A process for
in-season fertilizer nitrogen application based on predicted yield
potential. U.S. Patent. 6,880,291 B2, Issued, April 19, 2005.
5. Stone, M.L., D. Needham, J.B. Solie. W.R. Raun, and G.V. Johnson. 2005. Optical Spectral Reflectance Sensor and Controller. U.S. Patent. 6,855,933 B2, Cont. of 6,596,996, Issued Feb 15, 2005.
6. Raun, W.R., G.V. Johnson, J.B. Solie, M.L. Stone, K.W. Freeman. 2007. Use of within-field-element-size CV for improved nutrient fertilization in crop production. US Patent No. 7,188,450 B2. Issued, March 13, 2007.
1. Predicting Mid-Season Yield Potential (YP0)
A. N-Rate Field Experiments: At multiple locations, experiments must be set up in areas where a response to applied N is likely or at least probable. It is important to avoid those sites where N is known to have been applied liberally over the years. At each site, 3 to 5 N rates (all applied preplant) should be evaluated with the highest N rate being chosen in order to be “non-limiting” throughout the growing season, but not in excess. In general 100 to 150 kg N/ha applied preplant will be adequate for maximum yields (e.g., expected in winter wheat, but these rates could be as high as 400 kg N uptake/NUE)/ha, depending on the crop.
Plot size: large enough to accommodate taking several sensor readings throughout the season, and where actual yield (grain and/or forage) data can be collected. Individual plots should be no larger than 10x10 ft or 3x3m.
Replications: 4 or more
B. NDVI readings using the GreenSeeker handheld sensor: NDVI stands for “Normalized Difference Vegetation Index” and it is the “sensor” value displayed on your GreenSeeker handheld. NDVI is computed by the following formula where each represents reflectance in the following bands (near infrared-red)/(near infrared +red). Many researchers have shown that NDVI is an excellent measure of total biomass. Sensor readings from each of the plots delineated in 1A need to be taken at or near the physiological growth stage where mid-season N applications are made. In winter wheat this is roughly near Feekes 5 (post dormancy when leaf sheaths begin to lengthen), and Feekes 6 in spring wheat (prior to first hollow stem). For corn, sensor readings need to be collected by plant or for every 2 plants, somewhere between the 10 and 12 leaf stages.
C. Days from Emergence: In order to generate an equation that functions over sites and years (multiple sites, planted at different times and sensed on different dates), it is critical that planting date and emergence date are recorded. This date is then used to compute the number of days from planting to sensing or emergence to sensing (site and crop specific). In regions where winter conditions are prevalent for much of the growing season, it is important to compute days where GROWING DEGREE DAYS (GDD) were more than 0. GDD = (Tmin + Tmax)/2 – 4.4°C (The value “-4.4 °C will change as a function of the crop’s minimum heat requirement for active growth, so this value works for many “cool season” crops, but will be somewhat higher for warm season crops) where Tmin and Tmax are minimum and maximum daily temperatures, respectively.
D. Estimating Yield Potential: By dividing NDVI (estimate of total biomass) by the number of days from planting to sensing (or emergence to sensing), we basically end up with an estimate of biomass produced per day (note that to count a day, GDD must be >0 as noted above in 1C). This index (NDVI/days from planting to sensing or emergence to sensing) which is called INSEY (In Season Estimated Yield) is an excellent predictor of yield potential or the yield (grain or forage depending on the system) that is likely to result with no added inputs. This estimate of yield or yield potential is essentially the YIELD GOAL with no added fertilizer N.
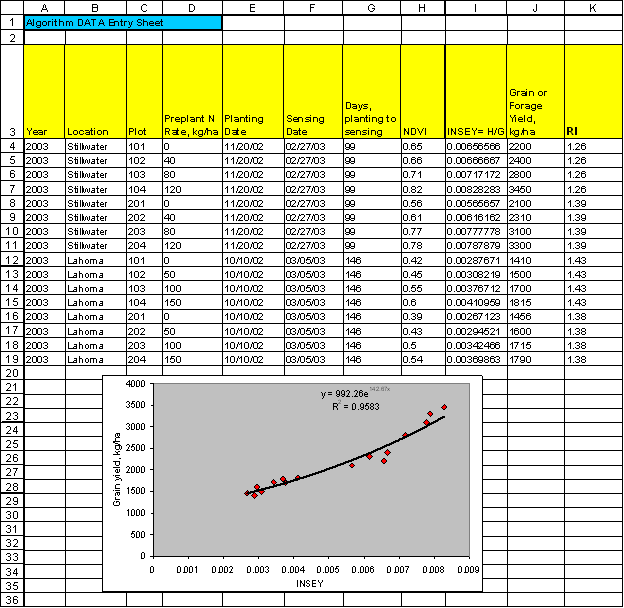
E. Generating the Yield Prediction Equation: Once actual harvest data has been collected from each of the plots in 1A, and placed in the same data file and for the same corresponding plots where NDVI, planting date, sensing date, and INSEY (computed in D), an X-Y plot of yield versus INSEY needs to be made (see example data sheet below).
F. Recording the Response Index (RI) at each Site: At each location where the N-rate experiments defined in 1A are conducted, it is critical that mid-season RI’s are recorded. To do this, average NDVI readings from the high N plots are divided by the average NDVI readings in the check plots (0-N preplant). Depending on the year, location and crop, RI’s can be expected to range fom 1.0 to 3.0. This information will be used to later document ‘responsiveness’ to fertilizer N by site.
G. Determination of % N in the Grain or Forage of the Crop Investigated: In general the percent N removed in each grain or forage crop for specific regions is well known. However, if it is not, determining %N (using dry combustion or wet-acid-digest) is possible at any commercial laboratory. All you have to do is compile enough grain or forage samples (50-100), and submit them to the commercial lab, and compute the average. For winter wheat in Oklahoma, the percent N in the grain averages 2.39%, 1.18% for corn grain in Nebraska, and 2.45% for spring wheat in North Dakota. For the crop in question, just take enough samples, and that are representative of the varieties used in the region.
2. Predicting the Potential Response to Applied N
A. Nitrogen Rich Strips: A critical component of the algorithm is being able to precisely predict whether or not there will be an in-season response to applied fertilizer N and the magnitude of that response. The only way to do this is to place “PRE-PLANT” Nitrogen-Rich Strips (NRS) in each and every farmer field where FERTILIZER N RATE RECOMMENDATIONS are to be made. Preferably, the NRS should be placed from one end of the field to the other (somewhere in the middle and not on the outer edges where fertilizer applicator error can be problematic…. turning, double planting, etc). The width of the NRS will vary from one location to another, depending on how wide the fertilizer spreader is that is used. One pass through the center of each field is sufficient. Application rate for the NRS should be high enough to ensure that nitrogen availability will not limit grain production.
Once the NRS’s are established in farmer fields, researchers are encouraged to visit these sites to ‘observe’ the differences between the NRS and the farmer practice. The farmer practice does not need to conform to anything specific, except that the rate should be somewhat N-limiting (50% or less than the NRS) and, it would be useful to know how much N was applied preplant using his conventional methods, and that amount applied in the NRS. Depending on the location, NDVI readings (100-200 feet in length) will be collected sometime in the middle of the growing season (from both the NRS and the Farmer Practice (FP)) when “N Fertilizer Adjustments” can be made. In winter wheat this is generally 90 to 120 days after planting (Feekes growth stage 5), and in corn it is at the 8 to 12 leaf stage (40 to 50 days after planting). This will be highly dependent upon the crop in question and the region where it is grown.
B. Computing the Response Index (RI): The Response Index (RI) or the potential responsiveness to added fertilizer N expected is calculated by dividing the average NDVI in the Nitrogen Rich Strip (NRS) by the average NDVI in the Farmer Practice (FP). This will generally range somewhere between 1.0 and 3.0. If for example the Response Index were 1.5, it would mean that we can likely achieve a 50% increase in yield if added fertilizer N is applied. It says nothing about how much N should be applied, but it does indicate the likelihood of obtaining a response and how much of a response can be expected. What we are doing here is “Predicting the Potential Responsiveness of the Crop to Applied N” for that year, that field, that crop, under those growing conditions, planted on x-date and sensed on x-date. This information is also highly tailored to the response expected to N and only N. Because the Nitrogen Rich Strip compared to the Farmer Practice only evaluates the difference between “N non-limiting” or the NRS and the Farmer Practice “N possibly limiting”, the only thing that this RI can be used for is N fertilization.
In theory, the same approach could be used for other elements such as sulfur, whereby we could have a Sulfur Rich Strip (SRS) where S was non-limiting, compared to the farmer practice where no S had been applied. If there were a large difference between the two, it is possible that S as ammonium sulfate could be applied to correct for the deficiency.
3. Yield Potential Achievable with Added N Fertilization (YPN)
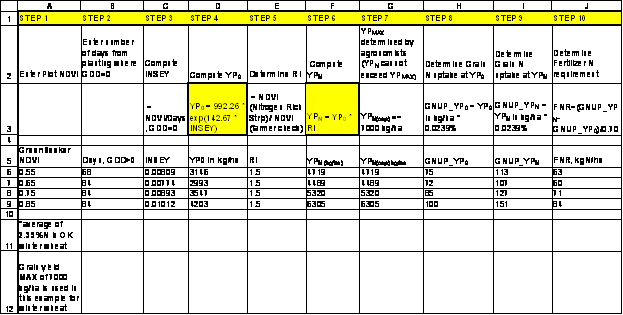
A. Predicting YPN: The predicted attainable yield with added nitrogen is calculated as:
YPN = YP0 * RI
where the response index was calculated as previously described. As was noted earlier, this could be for different nutrients, but as specified here it is for nitrogen. It should be noted that two limits are preferably imposed on this calculation, namely: 1) RI generally cannot exceed 3.0; and 2) YPN cannot exceed YPMAX where YPMAX is the biological maximum for a specific crop, grown within a specific region, and under defined management practices. The value of 3.0 for maximum RI, is arbitrary and may vary for a specific crop, grown in a specific region under different conditions.
B. Keeping YP0 and RI Separate: It is important to understand that the Yield Potential Achievable with no added N fertilization (YP0) needs to be understood independent of the Response Index (RI). The responsiveness to applied fertilizer N has nothing to do with the “expected yield” unless of course it was tied into how much fertilizer N was applied. For this reason, you must be very careful to keep these two components as independent inputs. Many researchers have used the sufficiency concept whereby N fertilizer is applied whenever the “Check” plot shows up as “lighter green” (lower NDVI or chlorophyll meter reading) than the Nitrogen Rich Strip. While useful, this approach still says nothing about exactly “how much” fertilizer N should be applied, but rather that “some” needs to be applied. The approach delineated here keeps RI and YP0 apart, simply because we apply N based on responsiveness, but with the specific yield potential in mind.
C. Yield Potential and Response Index Change from Year to Year: Whether it is due to planting date, timely or untimely rainfall, etc., yield potential in the same field will vary from one year to the next even when “managed” the same. The Response Index (RI) changes in the same field from one year to the next simply because of the marked influence of “environment” on N availability. N mineralized from soil organic matter can be quite high one year (warm and wet) and quite low the next (cool, and dry). The environmental conditions conducive to the mineralization of soil organic matter are quite variable and as such the demands for fertilizer N should be expected to be variable from one year to the next as well. In others words the ability of the environment to supply N (via mineralization of soil organic matter and/or deposited in rainfall) are quite variable and we need to take this amount of N supplied by the environment into consideration when making mid-season fertilizer N recommendations. We do this by carefully evaluating the Nitrogen Rich Strip and the Farmer Practice where an ‘estimate’ of how much N was supplied by the environment is available. Our research has shown that even in long-term plots where NO NITROGEN has been applied for over 30 years, we can in some years produce NEAR MAXIMUM yields with no applied N. How? This has been recorded in warm, wet years where enough N was mineralized from the soil organic matter and N supplied in the rainfall was sufficient to provide for all of the N needs for maximum yields.
4. Generating a Fertilizer N Rate Recommendation
A. Computing Grain N Uptake at YP0 and YPN: The predicted amount of N that will be removed in the grain at harvest (using our equation generated from 1E) is computed as follows:
Grain N uptake, YP0 = Grain Yield (YP0) * expected % N in the Grain or Forage
GNUP_YP0 = YP0*0.0239
GNUP_YPN = YPN*0.0239
where 0.0239 represents 2.39%N in the grain for winter wheat grown in Oklahoma.
B. Computing the Final Fertilizer N Rate: The fertilizer N rate to be applied is computed by subtracting the predicted amount of N to be removed in the grain at YP0 from the predicted amount of N to be removed in the grain at YPN, divided by some level of expected use efficiency. In the example below, we use 70% or 0.70 as the divisor, but this value can range anywhere from 50% to 80%. Why do we subtract GNUP_YP0 from GNUP_YPN ? The best estimate of projected N removed in the grain (with and without fertilizer) come from GNUP_YP0 and GNUP_YPN, respectively. Because of this, N requirement (based on projected N removed in the grain with and without N fertilizer) should theoretically be the difference between the two divided by an efficiency factor.
5. Added Information Needed
A. Forage N uptake versus NDVI: Although not necessarily required for the development of the algorithm, it is advisable for the researchers to collect NDVI readings from small scale plots and where they can determine the relationship between this reading and forage biomass, and forage N uptake. In order to do so, this analysis is destructive. In other words, in these plots where NDVI readings are taken mid season, the forage will be physically harvested, dried, ground and analyzed for total N. By multiplying dry weight by the percent N in the forage, forage N uptake can be obtained and correlated with the NDVI readings that were collected before the forage was harvested.
