 Physiological
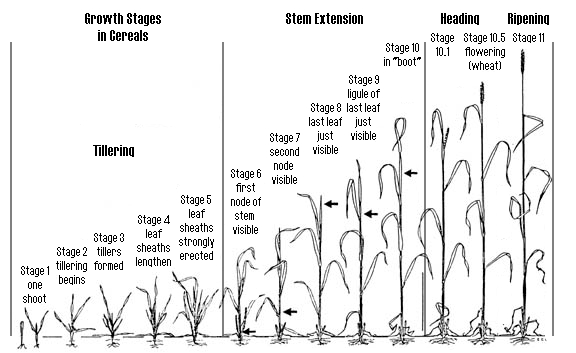
Feekes Growth Stages in Winter Wheat
Physiological
Feekes Growth Stages in Winter WheatCritical level for GDD (NDVI versus Yield)

According to Large (1954) cereals develop as follow Feekes Growth Stages
Stage
T I L L E R I N G
1
One shoot (number of
leaves can be added) = "brairding"
2 Beginning
of tillering
3 Tillers
formed, leaves often twisted spirally. In some varieties of winter wheats,
plants may be "creeping" or prostrate
4 Beginning
of the erection of the pseudo-stem, leaf sheaths beginning to lengthen
5
Pseudo-stem (formed by
sheaths of leaves) strongly erected
S T E M E X T E N S I O N
6
First node of stem
visible at base of shoot
7 Second
node of stem formed, next-to-last leaf just visible
8 Last leaf
visible, but still rolled up, ear beginning to swell
9 Ligule of
last leaf just visible
10 Sheath of last leaf
completely grown out, ear swollen but not yet visible
H E A D I N G
10.1 First ears
just visible (awns just showing in barley, ear escaping through split of sheath
in wheat or oats)
10.2 Quarter of heading process
completed
10.3 Half of heading process
completed
10.4 Three-quarters of heading
process completed
10.5 All ears out of sheath
F L O W E R I N G (WHEAT)
10.5.1 Beginning of
flowering (wheat)
10.5.2 Flowering complete to top of ear
10.5.3 Flowering over at base of ear
10.5.4 Flowering over, kernel watery ripe
R I P E N I N G
11.1 Milky
ripe
11.2 Mealy ripe, contents of
kernel soft but dry
11.3 Kernel hard (difficult to
divide by thumb-nail)
11.4 Ripe for cutting. Straw
dead
Reference
Large, E.C. 1954. Growth stages in cereals. Plant Pathol. 3:128-129.

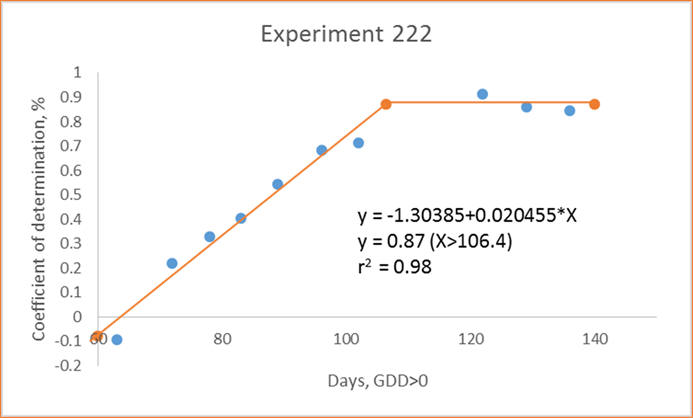
•Exp. 222, r2= 1.305+0.0204(GDD>0), when GDD<106; plateau for r2 at 0.87 when GDD>=106

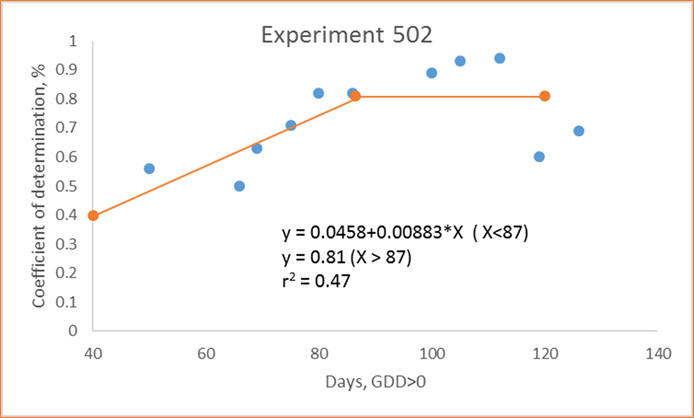
• Exp. 502, r2= 0.046+0.0088(GDD>0), when GDD< 87; plateau for r2 at 0.81
when GDD>= 87
Coefficients of determination
(r2) were recorded for linear regression equations from NDVI data collected
over the entire growing season (Figure x).
This included a range in GDD>0 of 50 to
126.
These coefficients were then paired with the
number of days from planting to sensing where GDD>0.
Once the r2 values were plotted against
GDD>0, the objective was to determine the point at which r2 values were
maximized and to simultaneously determine a point where changes further into
the season were capped.
A linear plateau model was
then used to determine the point at which r2 values no longer increased or
no longer showed a benefit in terms of predicting yield.
This question can go the other direction in
that it helped to determine how early yield could be accurately predicted
and not sacrifice precision.
Using the linear plateau model, the earliest number of days from planting to sensing where GDD>0, and that would be required to accurately predict wheat grain yields was 87.
It should be noted that the
data also suggests that yield should be predicted prior to reaching 112 days
(GDD>0) where after that time yield prediction was diminished.
