|
August 2014,
Hi Bill,
Quick question. On the Magruder plots
receiving chemical fertilizer, did it ever receive applications of sulfur as
part of a superphosphate?
Bailey Norwood
Associate Professor
Department of Agricultural Economics
Oklahoma State University
bailey.norwood@okstate.edu
(Response:),
Years ago, inorganic P was
sold as “ordinary super phosphate” which is 20%P2O5 and 12%S. OSP has been
available since the 1840’s. TSP (46% P2O5) has no S. It completely
replaced OSP in the early 60’s because the shipping industry, could
move more and per pound of "actual P" for a lot less. Nonetheless, your question is
a good one because OSP does have benefits, especially where S deficiencies
exist. When I was in Central America, based in Guatemala, we added gypsum
to the TSP as it helped in 2 ways. First it could assist with the S demands
that did exist on volcanic ash soils, and it also assisted in forcing P
precipitation as DCP and/or DCPD (di calcium phosphate and di calcium
phosphate dehydrate). The latter two forms are more available, and slowly
available with time versus a TSP product that will dissociate into highly
available ortho phosphate P forms, but that are more easily fixed in
volcanic ash soils (allophane and immogolite). Thus the reason why OSP
works better in volcanic ash soils. But…. the mystery continues…. TSP
could not have been applied in the Magruder Plots before 1959 (date of
invention in Bartlesville, OK… see below). and…. therefore, we have to
assume that OSP was used from 1892 to say 1960. So….. SULFUR had to have
been added to the P plot (1892-1960), simply because the availability of an
inorganic P source (as a commercially available fertilizer) would have been
OSP. I used to have all of the records for the Magruder Plots stored in
my office until I informed the Library. Whence upon they immediately came
over boxed it up, carted it off and apparently archived everything. It
could be in that same warehouse where the Arch of the Covenant from Indiana
Jones is stored! They even took some of my stuff. I still have the
original AC Magruder picture that “we” soil fertility guys hand down to the
next in line who will very soon be Dr. Arnall. Fun question, and hopefully
a fun answer. I will post this to our Magruder site so it isn’t forgotten.
Thanks! bill |
 |
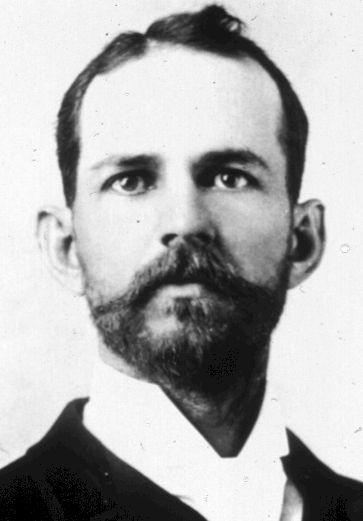
 Dr.
A.C. Magruder, 1867-1924 Dr.
A.C. Magruder, 1867-1924 |
LATITUDE: 36, 7.1844, N
LONGITUDE: 97, 5.3190, W
Annual Rainfall: 33 inches per
year (825 mm)
Mean Annual Temp: 59F, 15.5C
Kirkland silt loam (fine, mixed, thermic Udertic Paleustolls)
The Magruder Plots,
Untangling the Puzzle. (Agron J. 1191-1198)
The Magruder Plots:
Environmental Production History 1892-2004
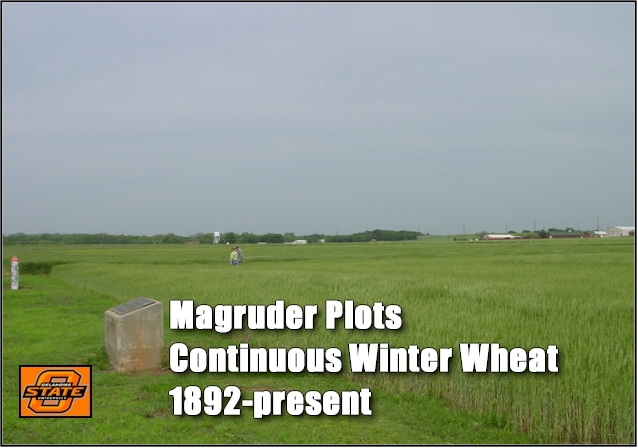
In 1892, A.C. Magruder initiated a soil fertility experiment which would
be continued for more than 100 years. The Magruder plots were initially
established to evaluate wheat production on native prairie soils without
fertilization. Although several changes have been made to the initial
trial, the Magruder plots remain the oldest continuous soil fertility
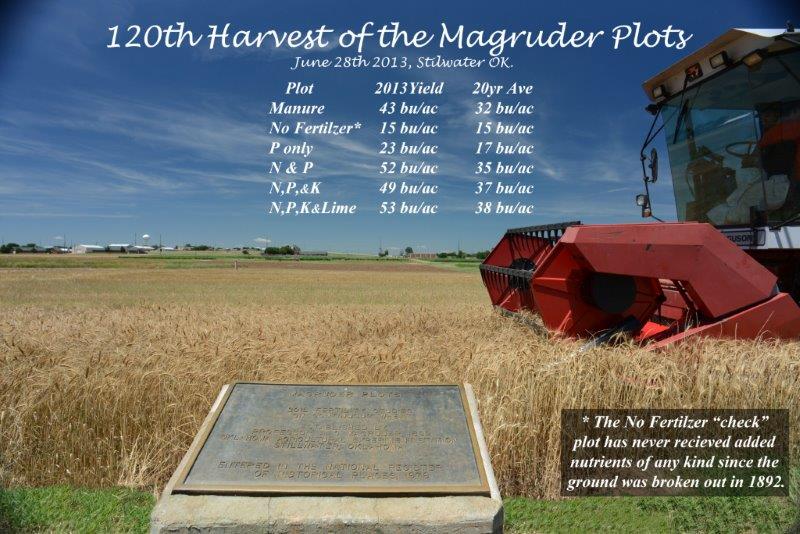
wheat experiment west of the Mississippi River. One of the key findings
of the Magruder Plots has been the sustained wheat production of more
than 16 bu/ac, following more than 100 years without any fertilization.
Not until the last 5-10 years have we seen any benefit of K
fertilization. Early on,
the response to P fertilization was notable (P-only versus the check).
As issues of sustainability and environmental safety become
increasingly more important, trials such as the Magruder Plots will be
further explored.
Procedures
Initially
only one plot was established to evaluate native wheat production
without the application of organic or inorganic fertilizers from 1893 to
1898. From 1899 to 1929, half of the experimental area was fertilized
with barnyard manure while the other half received no fertilization. In
1930, Dr. H.J. Harper established ten separate fertilization treatments
on these plots which would continue to 1947. Due to a university
construction decision for a new dormitory, plots from six of the ten
treatments were moved (surface 0- 16") following wheat harvest in 1947
to its present location on the Agronomy Research Station (Figure 1). The
subsoil at the new location was noted to be very similar to that of the
original site located just west of present day Stout Hall.
Table 1. Changes in
location and treatment modifications for Magruder plots,1892-present.
|
Year
|
Trts.
|
Nitrogen source
|
N rate, lb. N/ac
|
N rate, manure lb. N/ac
|
P source
|
Row spacing inches
|
Seed Rate lb/ac
|
Loc.
|
Seed Type
|
|
1892-1898
|
1
|
-
|
-
|
-
|
-
|
7
|
75
|
Old
|
SRWW
|
|
1899-1912
|
2
|
Manure only
|
-
|
-
|
-
|
7
|
75
|
Old
|
SRWW
|
|
1913-1929
|
2
|
Manure only
|
-
|
120**
|
-
|
7
|
75
|
Old
|
HRWW
|
|
1930-1933
|
10
|
NaNO3
(16-0-0)
|
33
|
120**
|
OSP (0-20-0-12S)
|
7
|
75
|
Old
|
HRWW
|
|
1934-1945
|
10
|
NaNO
3(16-0-0)
|
33
|
120**
|
OSP (0-20-0-12S)
|
14
|
50
|
Old
|
HRWW
|
|
1946-1947
|
10
|
NH4NO3(33.5-0-0)
|
33
|
120**
|
OSP (0-20-0-12S)
|
14
|
50
|
Old
|
HRWW
|
|
1948
|
6
|
NH4NO3(33.5-0-0)
|
33
|
120**
|
OSP (0-20-0-12S)
|
7
|
75
|
New
|
HRWW
|
|
1949-1957
|
6
|
NH4NO3(33.5-0-0)
|
33
|
120**
|
OSP (0-20-0-12S)
|
14
|
50
|
New
|
HRWW
|
|
1958-1967
|
6
|
NH4NO3(33.5-0-0)
|
33
|
120**
|
OSP (0-20-0-12S)
|
10
|
60
|
New
|
HRWW
|
|
1968-1993
|
6
|
NH4NO3(33.5-0-0)
|
60
|
240**
|
TSP (0-46-0)
|
10
|
60
|
New
|
HRWW
|
|
1994-pres
|
6
|
NH4NO3(33.5-0-0)
|
60
|
240**
|
TSP (0-46-0)
|
7.5
|
60
|
New
|
HRWW
|
Table 2. Soil fertility
treatment effects on Magruder Plot wheat grain yields, Stillwater, OK,
1930-2004
|
|
Treatment
N-P2O5
K2O
lb/ac/yr |
1930-37 |
1938-47 |
1948-57 |
1958-67 |
1968-77 |
1978-87 |
1988-97 |
1998-04 |
|
1. Manure only + |
|
24.1 |
17.5 |
18.0 |
29.9 |
30.2 |
34.1 |
28.0 |
39.5 |
|
2. |
0 |
0 |
0 |
16.6 |
9.5 |
13.3 |
18.9 |
18.0 |
19.6 |
15.1 |
18.6 |
|
3. |
0 |
30 |
0 |
21.2 |
15.9 |
19.1 |
21.5 |
18.8 |
22.4 |
14.7 |
20.4 |
|
4. |
33* |
30 |
0 |
22.6 |
17.2 |
19.8 |
31.7 |
36.0 |
30.5 |
27.4 |
41.7 |
|
5. |
33* |
30 |
30 |
23.4 |
17.4 |
19.9 |
29.4 |
33.9 |
30.9 |
32.4 |
44.6 |
|
6. |
33* |
30 |
30+ lime |
22.3 |
17.3 |
22.5 |
33.0 |
37.6 |
33.0 |
32.9 |
45.6 |
|
|
|
|
|
|
|
|
|
|
|
|
|
|
Mean |
|
|
|
21.7 |
15.8 |
18.8 |
27.4 |
28.9 |
28.4 |
25.1 |
35.1 |
|
SED |
|
|
|
2.6 |
1.8 |
1.8 |
2.0 |
2.6 |
1.9 |
2.6 |
3.7 |
|
* N rate increased to 60 lbs N/ac in 1968. + Beef
manure applied at a rate of 120 and 240 lb N/ac every fourth year
for periods 1930-1967 and 1967-present, respectively. Lime (L)
applied when soil analysis indicated a pH of 5.5 or less.
|


Figure 1. Physical location
and treatment structure of the Magruder Plots, 1947-present,
Agronomy Experiment Station, Stillwater
|

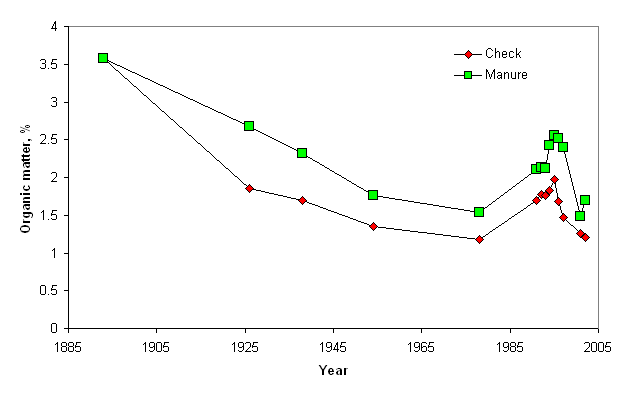
Figure 2. Changes in soil organic matter (%) in the
Magruder Plots, 1892-present.
|
 Magruder Plots


 Magruder Plots


