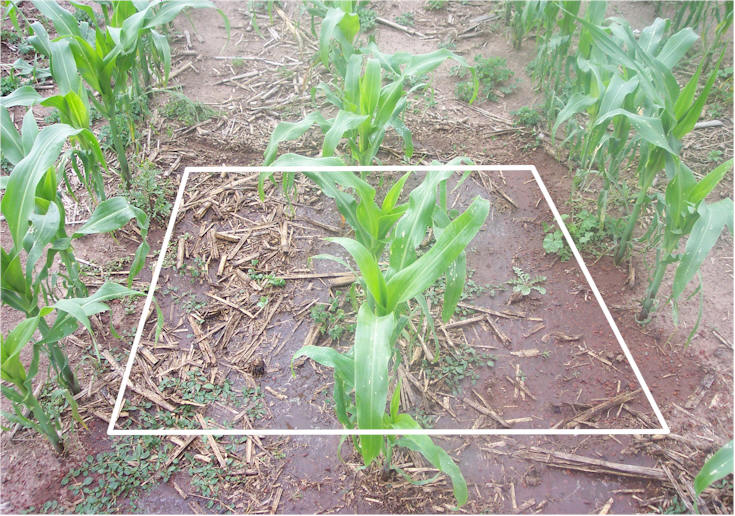
Area above sensed dry (3
readings), then the surface was moistened, and sensed again (3 readings)
Corn: V7-V8
Dry: NDVI = 0.515 +/- 0.11
Wet: NDVI = 0.538 +/- 0.21
Difference: = 0.023
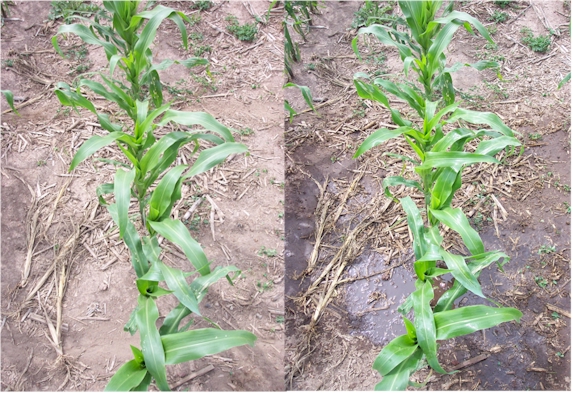
Corn: V7-V8
Dry: NDVI = 0.507 +/- 0.152
Wet: NDVI = 0.603 +/- 0.163
Difference = 0.096
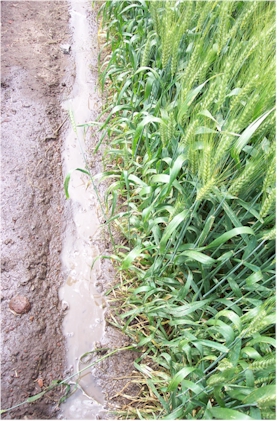
Spring Wheat:
Flowering
Dry: NDVI = 0.809 +/- 0.031
Wet: NDVI = 0.833 +/- 0.052
Difference: = 0.024
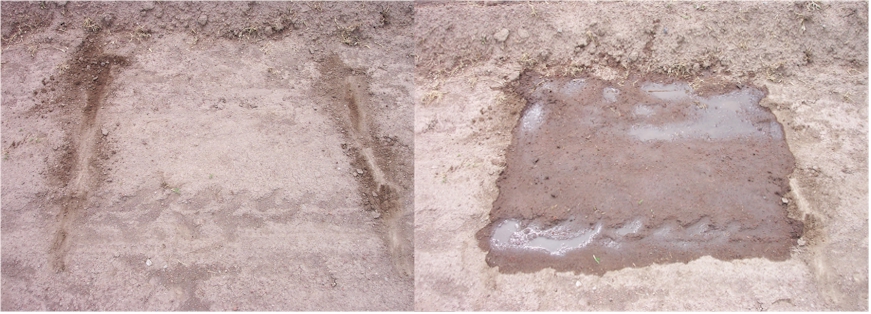
Bare Soil: El
Batan, MX
Dry: NDVI = 0.114 +/- 0.184
Wet: NDVI = 0.174 +/- 0.052
Difference: = 0.060
Wheat (no picture), Flowering
Dry: NDVI = 0.410 +/- 0.073
Wet: NDVI = 0.529 +/- 0.078
Difference: = 0.119
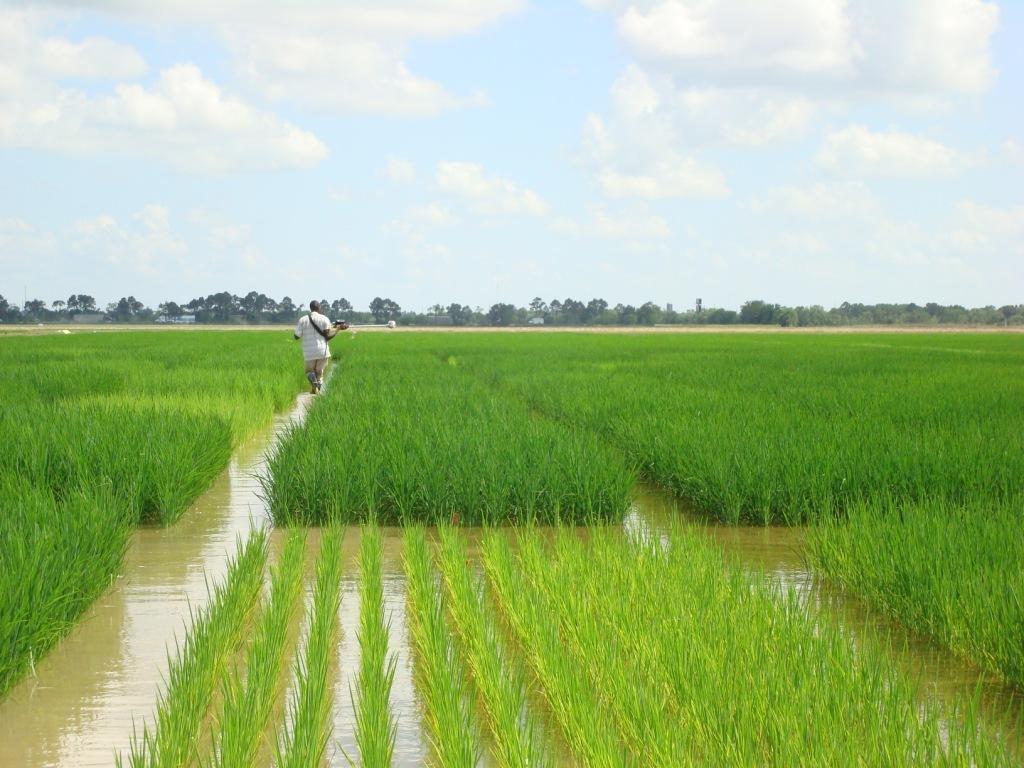
Flooded Rice Production, Louisiana
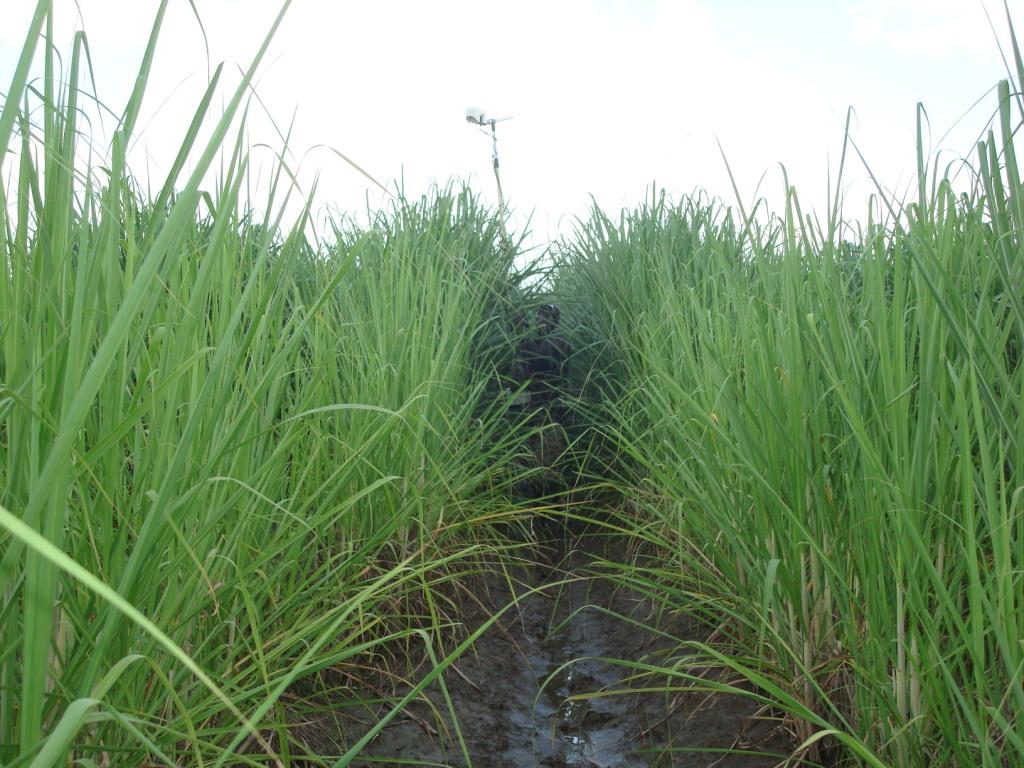
Sugar cane production, Louisiana
Muddy water: NDVI: 0.012, 0.000, 0.004, 0.005
Clear water: NDVI : 0.279, 0.300