 Indirect
Measures of Plant Nutrients
Indirect
Measures of Plant NutrientsDepartment of Biosystems and Agricultural Engineering
Oklahoma State University ABSTRACT
Indirect, non-destructive sensor based methods of plant and soil analyses could replace many of the wet chemistry testing methods that are in place today. Over 140 years have past since Justus von Liebig first employed soil testing in 1850. Today, simultaneous analyses of moisture, organic C and total N in plants and soils using non-destructive near infrared reflectance spectrophotometry is possible. Recent work has targeted indirect measurements of the nutrient status in soils using spectral radiance data collected from growing crop canopies. The use of spectral measurements from plant canopies has been driven in part by newer variable rate technologies which apply nutrients to prescribed areas. More recent work has documented significant soil variability on a 1m2 scale. Because of this, indirect measures are necessary to avoid the cost of chemical analyses (10000 samples required/ha) and to avoid on-the-go chemistry. Also, in order for application technologies to be environmentally sensitive, they must treat the resolution where real differences exist in the field. Present state-of-the-art methods can sense N deficiencies in winter wheat (December - February) on a 1m2 scale and apply variable foliar N on-the-go at 15 kph. These indirect methods rely on indices developed using the sufficiency concept that originally applied only to immobile nutrients. Plant canopy sensing methods allow for sufficiency to be used for both immobile and mobile nutrients since intensity and capacity can be integrated into one component, total nutrient uptake.
INTRODUCTION
Over 140 years have past since Justus von Liebig proposed the law of the minimum. This law implied that the nutrient present in the least relative amount would be the nutrient limiting production. Since Liebig’s time, scientists have been interested in whether or not elements were essential, the nature of their available forms in soil and the relationships between the amounts of these available forms and plant growth. The development of the science of soil fertility and soil testing has depended heavily on this knowledge. Early work by Bray (1948) outlined the criteria for a successful soil test. Perhaps the most important was that the amounts extracted (chemical soil extraction) need to be correlated with the growth and response of the crop to that nutrient under various conditions. Recent work by Peck and Soltanpour (1990) noted that a sound soil testing program is today’s best and perhaps only way of determining what constitutes adequate, but not excessive, fertilizer use for high and efficient crop production. With the advent of sensor based technologies, our challenge today is to apply the conceptual framework of soil testing and soil extraction to sensor based systems and non-destructive plant analyses.
Bray’s Mobility Concept
Before discussing the potential applications that sensors could have in ‘soil testing’ it is important to review one of the more fundamental concepts in soil fertility. The utility of soil testing was greatly enhanced by the work of Bray (1954) who identified two distinct types of soil sorption zones for plants. One is the large volume of soil occupied by the major part of the plant root system (root system sorption zone) from which mobile nutrients are taken up by plants. The other sorption zone is a relatively thin layer of soil adjacent to each root surface (root surface sorption zone) from which immobile nutrients can be removed by the plant (Figure 1). This concept has assisted many researchers in the development of appropriate methods of applying fertilizers depending on whether the nutrient elements are relatively mobile or immobile in soils.
Plants respond to the total amount present of mobile nutrients and to the concentration present of immobile nutrients in soils. Stated this way, yield is directly related (proportional) to the total amount of a mobile nutrient present in the soil. Therefore, nutrient depletion of the root system sorption zone is dependent on the environment, or growing conditions. Ideally, the response of crops to mobile nutrients should be linear because mobile nutrients (like water) are not decreased in availability by reaction with the soil. However, yield response to an immobile nutrient is not related to the total amount present in the soil, but instead is a function of the concentration of available form at, or very near, the root surface. Because of this, depletion of the root surface sorption zone is considered to be independent of environment.
Sensor-Based-Analyses
When white light from the sun strikes the surface of soil or plants, it is reflected in wavelengths that have a characteristic frequency and energy (Figure 2). The visible portion of light can be separated into red, orange, yellow, green, blue and violet. Wavelengths and relative energy levels of gamma rays, x-rays, ultraviolet, infrared, microwave and radio waves are also reported in Figure 2. If for example red light was absorbed by a certain substance, we would actually be seeing green (visible color absorbed compared to the visible color transmitted, Figure 2). If blue light were absorbed we would see yellow. Keeping this in mind, the yellow-green color that we associate with nitrogen deficiencies should be characterized by having more violet light absorbed by the plant material (Figure 2). Or alternatively, the intensity of green in plants should be characterized by the amount of red light absorbed. Phosphorus deficiencies in plants should theoretically result in increased absorbance of green light since increased purple coloring of leaf margins and stems is expected. What is actually being measured in many sensor based systems is spectral radiance, or the radiated energy from plant and soil surfaces.
Early Use of Spectral Data for Non-Destructive Chemical Analysis
The potential replacement of wet chemical methods with non-destructive spectral analyses was first seen over 20 years ago. Near infrared (NIR) diffuse reflectance spectrophotometry was first used to measure protein, moisture, fat and oil in agricultural products. Initially, leaf reflectance measurements at 550 (green) and 675 nm (red) were used to estimate the N status of sweet peppers (Thomas and Oerther, 1972). The NIR spectral region has also been used for predicting organic C and total N in soils. Each constituent of an organic compound has unique absorption properties in the NIR wavelengths due to stretching and bending vibrations of molecular bonds between elements (Morra et al., 1991). One band (780-810nm) is particularly sensitive to the presence of amino acids (R-NH2) which are the building blocks of proteins. The presence and/or absence of these amino acids largely determines the N content of the plant. Because of this, many researchers believe that if the plant canopy could be characterized using spectral data, the development of an indirect soil test (or measure of soil nutrient supplying capacity) could be possible.
Plant and Soil Spectral Indices
Work by Becker and Choudhury, (1988) found that the microwave polarization difference index (MPDI) could be used to detect the water contents of plants while NDVI was sensitive to chlorophyll absorption. Filella et al. (1995) indicated that leaf chlorophyll A content is mainly determined by N availability. They found improved correlation between measured chlorophyll A and leaf reflectance at 550 and 680 nm, compared to NDVI. Gamon et al. (1992) used a physiological reflectance index (PRI) to track diurnal changes in photon efficiency (CO2 uptake/absorbed photosynthetically active radiation = Rref -R531/Rref + R531 where Rref was a reference wavelength and R531 represented spectral radiance at 531 nm). Peñuelas et al. (1993) examined a water band index (WBI) defined as R950/R900 because the reflectance spectrum was associated with a water absorption band. They also evaluated a normalized total pigment to chlorophyll A ratio index (NPCI) defined as (R680-R430)/(R680+R430). They reported that NPCI was highly correlated with chlorophyll content and was a rough estimate of the ratio of total pigments to chlorophyll A, decreasing in healthy plants and rising in stressed or senescing plants.
Indirect measures for soil analysis have been considered by scientists in various disciplines. Ben-Dor and Bannin (1995) reported that simultaneous and rapid, nonrestrictive determination of clay content, organic matter, cation exchange capacity, hygroscopic moisture, and specific surface area was possible using high-resolution diffuse reflectance spectra in the near-infrared region. Using a fixed 1.5 MPa gravimetric moisture content for 30 representative soils in Illinois, Sudduth and Hummel (1993) found good correlation between spectral reflectance (100-scan average of 1600-2620 nm) and soil organic C.
Phosphorus Using Fluorescence
Studies by Shchurina (1990) used the XR-23 desktop analyzer (LECO) to determine phosphorus in soil and plants. X-rays were directed at the surface of the sample, penetrating a depth of <0.5mm and the fluorescence from the sample was subsequently passed through a curved pentaerythritol crystal and the characteristic fluorescence of phosphorus was read. Fluoresence is essentially the reemission of absorbed light as light energy but of a longer wavelength and of lower energy than what was initially absorbed. The fluorescence spectrum is characteristic of the pigment, therefore it is possible to tell which pigment is fluorescing. Lauer et al. (1989) indicated that low phosphate nutrition results in increased chlorophyll fluorescence, reduced photosynthetic rate, accumulation of starch and sucrose in leaves and low crop yields. They further noted that leaves of plants grown under high P fertility had significantly higher light saturation points (400-700 nm) and higher apparent quantum efficiency. Gamon et al. (1990) indicated that the spectral irradiance changes in the red and near-infrared regions when suddenly illuminated were caused by the quenching of chlorophyll fluorescence. The fluorescence was fully induced within a few seconds of increased illumination, and relaxed over the next several minutes.
Detection of Field Variability, Need for Sensor Based Technologies
The variability in bermudagrass forage yield when harvested from 0.30 x 0.30 m grids (1x1ft), 22 m in length is illustrated in Figure 3. This site and others have shown that large differences exist over very short distances. Forage yield changed by a factor of >4 over 1.2 m at the end of the transect. Similar differences were noted in total soil N and organic C (using dry combustion). This was important to find, considering that the precision of this instrumentation is ±0.001%, and because the change in total N and organic C occurred in the same sampling units as that noted for yield.
Using semivariograms and mean difference analyses generated from sensor data collected every 4 cm, Solie et al. (1996) estimated that the fundamental field element size averaged 1.5 m. The fundamental field element was defined as the area which provides the most precise measure of the available nutrient and where the level of that nutrient changes with distance. Data collected by the sensor based variable rate technology team in Oklahoma continues to show that field element sizes are seldom more than 1m2 (wheat and bermudagrass). If the resolution where ‘real’ soil differences exist is at 1m2, grid soil sampling will never be economical (10000 soil samples / hectare). Also, if variable rate technology is truly going to be environmentally sensitive, it must be implemented at the resolution where real differences are encountered in the field.
Sensor Based or Map Based Technology?
Much has been learned over the past 150 years concerning the use of soil testing and improved use of fertilizers. Today, we are on the verge of using newer non-destructive sensor based technologies which sense nutrient uptake in growing crop canopies. Sensor based systems are now capable of detecting nutrient needs on-the-go and can simultaneously apply prescribed fertilizer rates based on those needs. Spectral radiance measurements for red (660 nm) and near infrared (NIR, 780 nm) wavelengths have been measured in wheat from December to February using photodiode based sensors (Stone et al., 1996, Solie et al., 1996). This work has shown that the plant nitrogen spectral index (PNSI) was highly correlated with wheat forage N uptake at several locations, using a wide range of varieties. PNSI is the inverse of the normalized difference vegetative index (NDVI), commonly used in remote sensing. This is important since several researchers have shown that wheat forage total N uptake during the winter months can be a predictor of topdress N needs (Roth et al., 1989, Vaughan et al., 1990a). Because N uptake can be predicted indirectly using spectral radiance measurements, sensors can reliably provide measurements equivalent to 'on-the-go' chemical analyses. Using the PNSI index, fertilizer N has been topdressed from January to February using ‘prescribed amounts’ based on the spectral radiance measurements (Stone et al., 1996). Grain yields have increased as a result of applying topdress N and no differences have been found between variable and fixed N topdress rates. Varying N rates based on PNSI resulted in improved N use efficiency when compared to the fixed topdress N rates. In addition to improving site-specific N use efficiency, this technology will likely decrease the risk that over fertilization poses to the environment.
Similar to taking soil samples and generating a fertilizer recommendation based on that data, sensor based systems collect equivalent data; however, they do so on a much finer scale. The sensor-based N fertilizer applicator developed by Stone et al. (1996) collects the equivalent of 10000 samples per hectare and applies a prescribed rate to 10000 independent 1 m2 areas within each hectare.
Sensor based systems collect data (e.g., spectral radiance) on-the-go from the plant canopy or soil. Without having a known reference or fixed position, the sensor data is then used to apply fertilizer or other agricultural chemicals (to the area which was read) at prescribed rates. Present map based systems require the use of global positioning systems or GPS. These systems were first developed for military purposes in order to better locate a specific target or position. Although this satellite based system is still used by the military, it is now available for a wide range of uses. Conventional GPS systems used today have a resolution of ±10m. What this means is that one 100m2 area (10mx10m) could be confused for another neighboring 100m2 area when relying on the information delivered from GPS units. Using differential correction (DGPS), this resolution can be ±1m. Yield monitoring systems are map based and the mapping resolution depends on GPS resolution. However, these map based approaches continue to rely on yield data collected from combines, where it is presently not possible to obtain this information on a 1m2 scale. Most yield monitoring systems have been placed on combines with 5 m wide headers (and wider). Time delays and mixing associated with grain that passes through combines have not been fully accounted for. Without this knowledge, yield mapping resolution is still a long way away from a 1m2 scale. Finally, yield mapping on its own is void of a cause and effect relationship unless the effect of additional variable(s) (soil test, satellite sensing, etc.) are determined separately.
Sensor based variable rate systems avoid traditional costs (such as soil sampling, chemical analysis, data management, and recommendations) and can instantaneously adjust the application rate based on sensor measurements of fertility as the applicator travels across the field. Present sensor based systems operate at a much finer resolution than commercially available GPS units. This is important if we consider the fundamental field element size to be a significant variable as it relates to fertilizer applications and environmental safety.
Fertilizer Response
Vaughan et al. (1990a) found that whole-plant total N at Feekes 5 could be used for making fertilizer recommendations in winter wheat. Similar work by Roth et al. (1989) found that total N between Feekes 4 and 6 accounted for the most variation in relative yields. This work also noted that N uptake was the weakest predictor of N deficiency. Considering the field element size where differences are observed (1m2), we feel the poor results with N uptake from Roth et al. (1989) may have been due to sampling error (10 plants selected from outside rows that were separated by distances equal to or greater than 1m, and where the grain yield data was obtained from the center rows, different from that used for total N uptake).
Similar to the work by Vaughan et al. (1990a) and Roth et al. (1989), work at Oklahoma State University has focused on using whole-plant total N in winter wheat at Feekes 5. However, unlike the work reported earlier, we have successfully used total N uptake, largely because both yield and concentration data (combined to determine uptake) were collected from much smaller plots where sensed data (entire canopy), total N uptake and yield were collected from the same areas. If the resolution where real differences exist in fields is at 1m2, then calibration data must be collected on the same scale.
Work in Oklahoma has found significant increases in wheat grain yield from topdress N applied between December and February. Various researchers have found increased fertilizer N use efficiency in winter wheat when N was split applied (Mahler et al., 1994) or topdressed before mid January (Boman et al., 1995). Variable rate technology capitalizes on this work by reducing the total field N rate, while also having the potential to optimize N use efficiency because a much finer resolution is used. Spring applied N can result in increased N use efficiency when compared to fall applied N in winter wheat thus making sensor based variable rate technology increasingly beneficial since spring plant N is used as an indicator variable.
Initial results from sensor-based-variable-rate experiments by Stone et al. (1996) suggest that fertilizer N use efficiency can increase from 50 to 70% using this technology. This is largely because the sensors are capable of detecting large differences within extremely small areas (1m2) in an entire field. Instead of applying a fixed rate of 100 kg N/ha to a 100 ha field, this technology allows us to apply the prescribed amount to 1,000,000 individual 1m2 areas within the 100 ha field at N rates that range from 0-100 kg N/ha.
When fertilizers are applied in excess of that needed for maximum yields, the potential for nitrate leaching and groundwater contamination increases. If the resolution where real differences exist in the field is very fine, as this work has shown, the need for precision agriculture should increase because this defined resolution will be more environmentally sensitive. It is expected that fertilization practices will rapidly become tailored to the environment when using sensor based technology.
Lessons Learned from Soil Testing
Before sensor based systems are adopted, it is critical that soil scientists learn from the fortunes and failures of this technology. Those involved in the dual development of fertilizer recommendations from soil tests and sensor based systems need to report both what has worked and what has not. Soil testing may well have been more successful had it been allied with industry from the outset. Similar to the applications of Bray’s mobility concept for mobile and immobile nutrients in the soil, sensor based systems will need to consider the mobility of elements in the plant. Because the plant canopy acts as the indicator variable with sensor based systems, correct interpretation of visual symptoms is critical. For example, N deficiencies early in the season will show yellowing in older leaves while S deficiencies have very similar yellowing in younger leaves. Added characteristics of each technology are reported in Table 1.
It is important to note that there will be many interfering factors affecting fertilizer recommendations when using sensor based systems. While formal field experiments can remove all other factors excluding those being evaluated, the real world poses many additional problems. If a weed is present, and the sensor responds to it, one agronomic decision could be to not fertilizer that area (decreased potential for weed seed). By not fertilizing this area, this agronomic decision will ultimately lead to increased field variability for that fertilizer nutrient. Alternatively, fertilizer could be applied as normal, and a point injector could be used to ‘spot’ treat for weeds as they are detected in the field. Added problems include the presence of clouds, time of day, plant variety, and stage of growth, all of which have yet to be resolved.
CONCLUSIONS
Initial results suggest that total N uptake (whole plant) at Feekes 5 can be used for detecting relative N deficiencies. Relative N deficiencies (% sufficiency) can be translated into projected N deficiencies by multiplying them times yield goal. Initial work indicates total N uptake > 50 kg N ha-1 at Feekes 5 is 100 % sufficient for a winter wheat grain yield goal of 2.6 Mg ha-1. Yield potential appears to be defined at or near Feekes growth stage 5. The specific environmental or nutritional factors that control yield potential have not been defined. When Bray proposed sufficiency for immobile nutrients, environment had to be independent of the index. Irrespective of environmental conditions beyond Feekes 5, relative grain yields should be maximized when total N uptake equals or exceeds 100 % sufficiency. This statement implies that environment will be independent of relative maximum grain yields, which is not the norm for mobile nutrients. If the biomass and concentration of a plant were known, we believe that this information would integrate root system and root surface sorption zones. The plant integrates the availability of mobile N from the entire reservoir (e.g., NO3-N) and immobile N which is taken up via contact exchange at the root surface (e.g., NH4-N, mineralized organic N). The use of sensors on the entire plant canopy provides relative integration of both the root system sorption zone and root surface sorption zone. Supply of NH4-N could be that held on the exchange complex or that mineralized from organic pools. Combining biomass or percent coverage at Feekes 5 and N concentration, we end up with a parameter (total N uptake) that should work much like a sufficiency index. This is somewhat in opposition to Bray’s mobility concept which suggested that sufficiency could only be applied to immobile nutrients.
Finally, sensor estimates of biomass and concentration integrate the availability of both mobile NO3-N and immobile NH4-N. Vaughan et al. (1990b) suggested the need for including both soil NO3-N and NH4-N instead of NO3-N alone to measure available soil N to plants in the spring. Most commercial and state soil testing labs continue to focus only on NO3-N. Sensing the entire plant canopy for biomass and concentration is thought to be somewhat similar to a soil test that includes both mobile and immobile forms of N.
REFERENCES
Becker, Francois and Bhaskar J. Choudhury. 1988. Relative sensitivity of normalized vegetation index (NDVI) and microwave polarization difference index (MPDI) for vegetation and desertification monitoring. Remote Sens. Environ. 24:297-311.
Ben-Dor, E., and A. Banin. 1995. Near-infrared analysis as a rapid method to simultaneously evaluate several soil properties. Soil Sci. Soc. Am. Proc. 59:364-372.
Boman, R.K., R.L. Westerman, W.R. Raun, and M.E. Jojola. 1995. Time of nitrogen application: effects on winter wheat and residual soil nitrate. Soil Sci. Soc. Am. J. 59:1364-1369.
Bray, Roger H. 1948. Requirements for successful soil tests. Soil Sci. 66:83-89.
Bray, Roger H. 1954. A nutrient mobility concept of soil-plant relationships. Soil Sci. 104:9-22.
Filella, I., L. Serrano, J. Serra and J. Peñuelas. 1995. Evaluating wheat nitrogen status with canopy reflectance indices and discriminant analysis. Crop Sci. 35:1400-1405.
Gamon, J.A., C.B. Field, W. Bilger, O.Bjorkman, A.L. Fredeen, and J. Peñuelas. 1990. Remote sensing of the xanthophyll cycle and chlorophyll fluorescence in sunflower leaves and canopies. Oecologia 85:1-7.
Gamon, J.A., J. Peñuelas, and C.B. Field. 1992. A narrow-waveband spectral index that tracks diurnal changes in photosynthetic efficiency. Remote Sens. Environ. 41:35-44.
Lauer, Michael J., Stephen G. Pallardy, Dale G. Blevins and Douglas D. Randall. 1989. Whole leaf carbon exchange characteristics of phosphate deficient soybeans (Glycine max L.). Plant Physiol. 91:848-854.
Mahler, R.L., F.E. Koehler and L.K. Lutcher. 1994. Nitrogen source, timing of application, and placement: effects on winter wheat production. Agron. J. 86:637-642.
Morra, M.J., M.H. Hall, and L.L. Freeborn. 1991. Carbon and nitrogen analysis of soil fractions using near-infrared reflectance spectroscopy. Soil Sci. Soc. Am. J. 55:288-291.
Peck, T.R., and P.N. Soltanpour. 1990. The principles of soil testing. p. 1-9. In R.L. Westerman (ed.) Soil testing and plant analysis. 3rd ed. SSSA Book Ser. 3. SSSA, Madison, WI.
Peñuelas, Josep, John A. Gamon, Kevin L. Griffin and Christopher B. Field. 1993. Assessing community type, plant biomass, pigment composition, and photosynthetic efficiency of aquatic vegetation from spectral reflectance. Remote Sens. Environ. 46:110-118.
Roth, G.W., R.H. Fox and H.G. Marshall. 1989. Plant tissue tests for predicting nitrogen fertilizer requirements of winter wheat. Agron. J. 81:502-507.
Shchurina, G.N. 1990. Determination of phosphorus in soils and plants with the XR-23 X-ray fluorescence analyzer. Scripta Technica. 22(6):119-121.
Solie, J.B., W.R. Raun, R.W. Whitney, M.L. Stone and J.D. Ringer. 1996. Optical sensor based field element size and sensing strategy for nitrogen application. Trans. of the ASAE 39(6):1983-1992.
Stone, M.L., J.B. Solie, W.R. Raun, R.W. Whitney, S.L. Taylor and J.D. Ringer. 1996. Use of spectral radiance for correcting in-season fertilizer nitrogen deficiencies in winter wheat. Trans. of the ASAE 39(5):1623-1631.
Sudduth, K.A., and J.W. Hummel. 1993. Soil organic matter, CEC and moisture sensing with a portable NIR spectrophotometer. Trans. of the ASAE. 36(6):1571-1582.
Thomas, J.R., and G.F. Oerther. 1972. Estimating nitrogen content of sweet pepper leaves by reflectance measurements. Agron. J. 64:11-13.
Vaughan, B., K.A. Barbarick, D.G. Westfall and P.L. Chapman. 1990a. Tissue nitrogen levels for dryland hard red winter wheat. Agron. J. 82:561-565.
Vaughan, B., D.G. Westfall, K.A. Barbarick, and P.L. Chapman. 1990b. Spring nitrogen fertilizer recommendation models for dryland hard red winter wheat. Agron. J. 82:565-571.
Table 1. Differences between soil testing and sensor based systems for developing nutrient recommendations.
|
Soil Testing |
Sensor Based Analyses |
|
||
Detection |
Plant available |
Plant status |
Sample collection >20 hectares |
1m2 |
|
Sampling |
soil, destructive |
plant, non-destructive |
Method |
Extraction & chemical |
Spectral radiance, |
|
analyses |
wavelength specific |
Analytical parameter |
Nutrient element |
Spectral radiance |
Interpretation |
Calibration with yield |
Calibration with yield |
Fertilizer Recommendation |
Procedure specific |
Wavelength specific |
|
||
Interfering Factors Affecting Fertilizer Recommendation |
|
|
|
Number of samples (reliability) |
|
|
Subsoil N availability |
- |
|
- |
Weeds |
|
- |
Clouds |
|
- |
Time of day (sun angle) |
|
- |
Variety |
|
- |
Stage of growth (% cover) |
|
- |
Living vs. dead plant tissue |
|
Field element size |
Field element size |
|
Calibration curve |
Calibration curve |
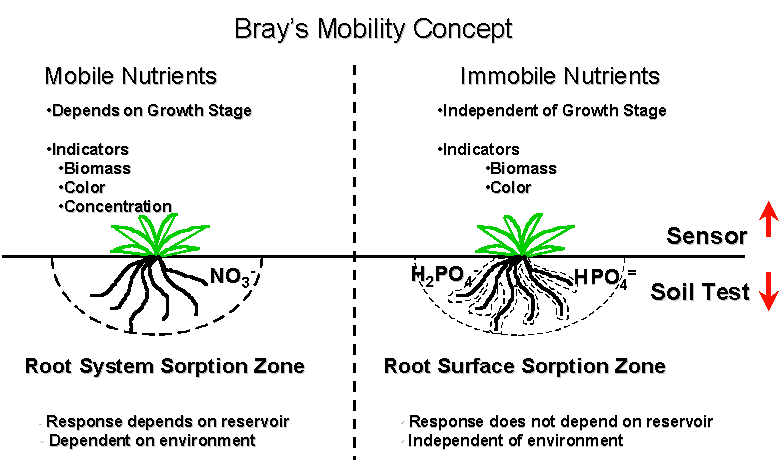
Figure 1. Root system and root sorption zones as related to mobile and immobile nutrients and the use of soil and sensor tests.
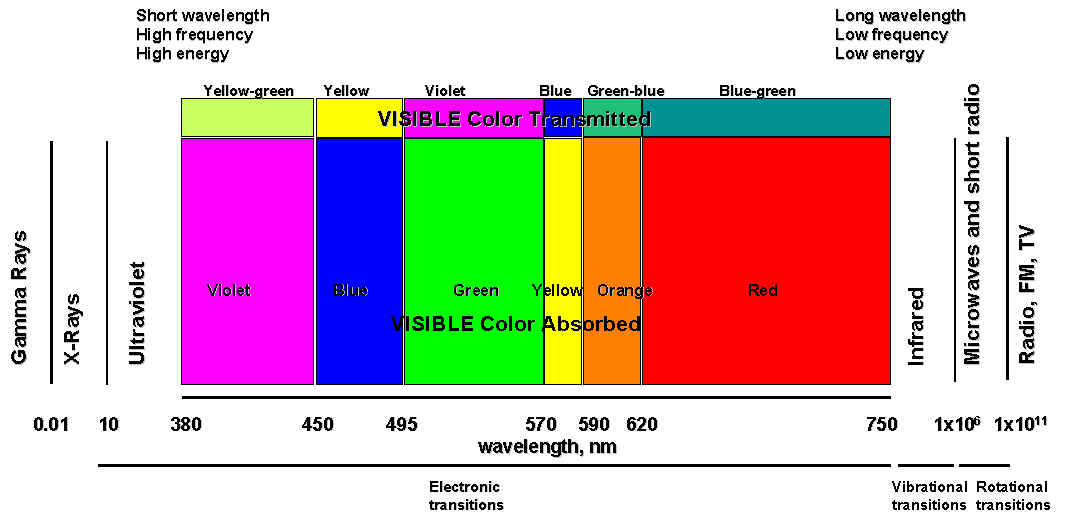
Figure 2. Characteristics of visible and non-visible portions of the spectra.
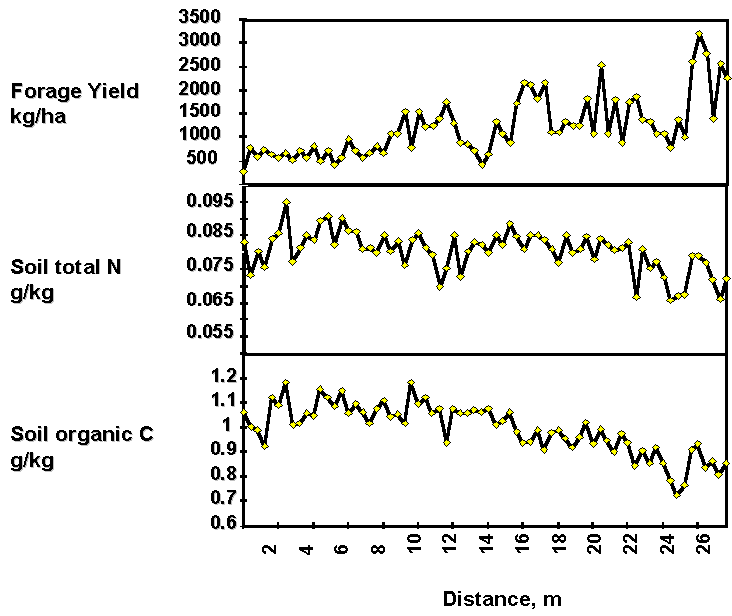
Figure 3. Variability in bermudagrass forage yield, total soil N and organic C sampled in 0.30x0.30m grids.