Can We Detect
Nitrogen Deficiencies With Sensors?
Can We Detect
Nitrogen Deficiencies With Sensors?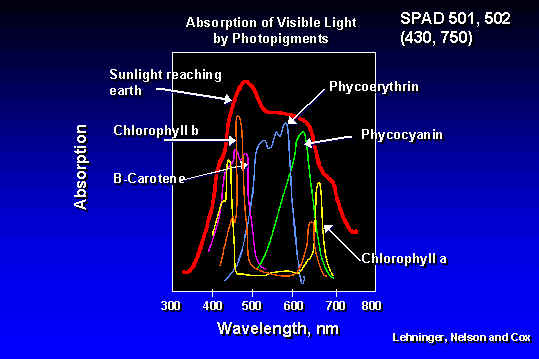
1. Early work using indirect measures to determine the N status of plants employed chlorophyll meters (SPAD 501 and 502) that measured transmittance at 430 and 750 nm.
2. Plant tissue N and chlorophyll meter measurements have been found to be highly correlated, but they are crop and growth stage specific.
3. Once a reliable calibration between chlorophyll measurements and N status of the plant was established, N fertilization regimes were developed.
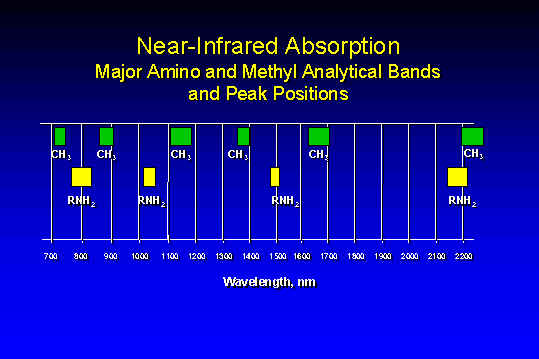
4. Similar to forage protein analysis using NIR, total N in growing plant tissue can be reliably detected from NIR measurements in the 780 and 1050 nm ranges
2. Spectral radiance measurements (Red and NIR) were collected from winter wheat at Feekes growth stages 4 through 10 and NDVI (normalized difference vegetative index) was determined (NIR-red)/(NIR+red) as per the work of Perry and Lautenschlager,1984, and Duncan et al., 1993.
3. Wet and dry biomass were recorded from each plot and forage subsamples analyzed for total N using dry combustion
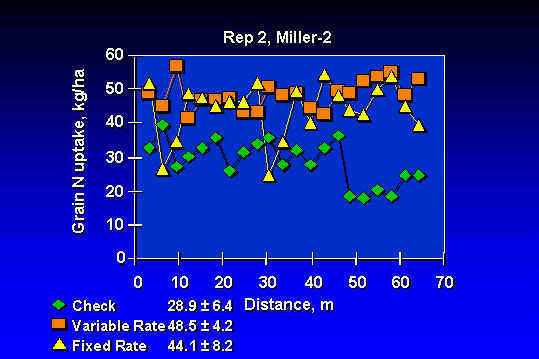
4. NDVI measurements were then correlated with the product of dry biomass and percent N (total N uptake) over a range of locations.
5. Once the calibration curve for NDVI and forage N uptake was established, corresponding N rates were applied based on NDVI (low NDVI - high N rate, high NDVI - low N rate).
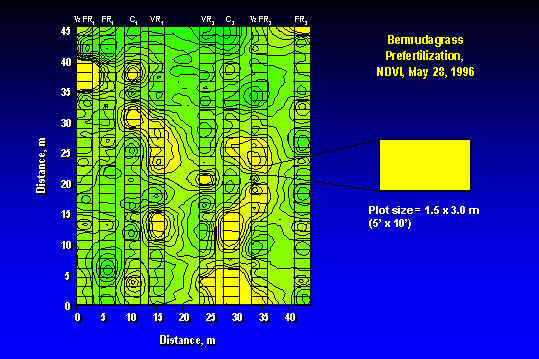
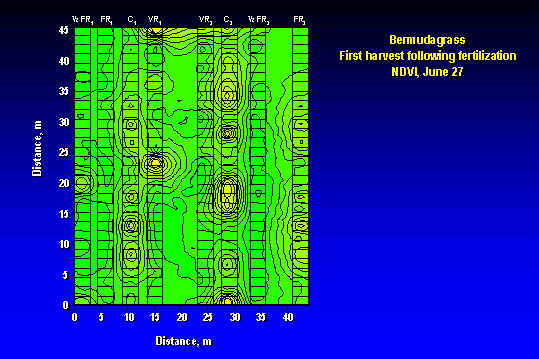
6. Although not required in this work, surface contour maps can be generated as are included below for pre and post N fertilization, using NDVI as the response variable. Also see Management Resolution
- Moisture availability (texture, water holding capacity)
- Nutrient(s) deficiency(ies) and/or toxicity(ies) interactions
- Crop and Variety within crop
- Preplant N rate/Topdress N rate (yield goal)
- Production system (forage vs. grain)
- Tillage (background)
- Weed interference/treatment (increased variability?)
- Row spacing (coverage, plant density)
- Resolution to be treated (field element size)
cost of misapplication (economic vs. environment)
- Can sensor based technologies assess subsurface nutrient availability?
- In 1970, 190,500,000 ha classified as arable and permanent cropland in the US
Decreased to 187,776,000 ha by 1991.
Cropland in the United States was 187,776,000 ha in 1993, a decline of 1.2% compared to 1983
Irrigated land in the United States peaked at 20,582,000 hectares in 1980 and has been stable at 18,771,000 hectares since 1989.
Trends suggest that cropland in the US will not expand beyond the present 190,000,000 ha
In the developing world 760,000,000 hectares are presently classified as cropland and could theoretically increase to 850,000,000 hectares.
World population increases by 86 million people per year (World Resources, 1996).
Cropland needed to feed the human population, if population growth stops and land is preserved, will be roughly 3.3 billion hectares, and likely to become limiting near the year 2050
Probability of bringing 3.3 billion hectares into production from the current 1.4 billion hectares is small (www.igc.org/millennium).
A large portion of the lands considered as 'potentially arable' (e.g., increase from 1.4 to 3.3 billion hectares) include tropical rainforests and other lands that would require massive inputs for any kind of sustained crop production.
Because it is unlikely that the total arable world land will increase beyond its present level, increased production per unit area will be essential. In this regard, applied precision agricultural production practices are timely and required within the developed and developing agricultural community.