 Should
We Manage Small-Scale Variability?
How Extensive is Small-Scale Variability in Agricultural Fields?
Agronomy Journal, 91:357-363
Improving Nitrogen Use Efficiency in Cereal Grain Production with Optical Sensing and Variable Rate Application. Agronomy Journal, 94:815-820
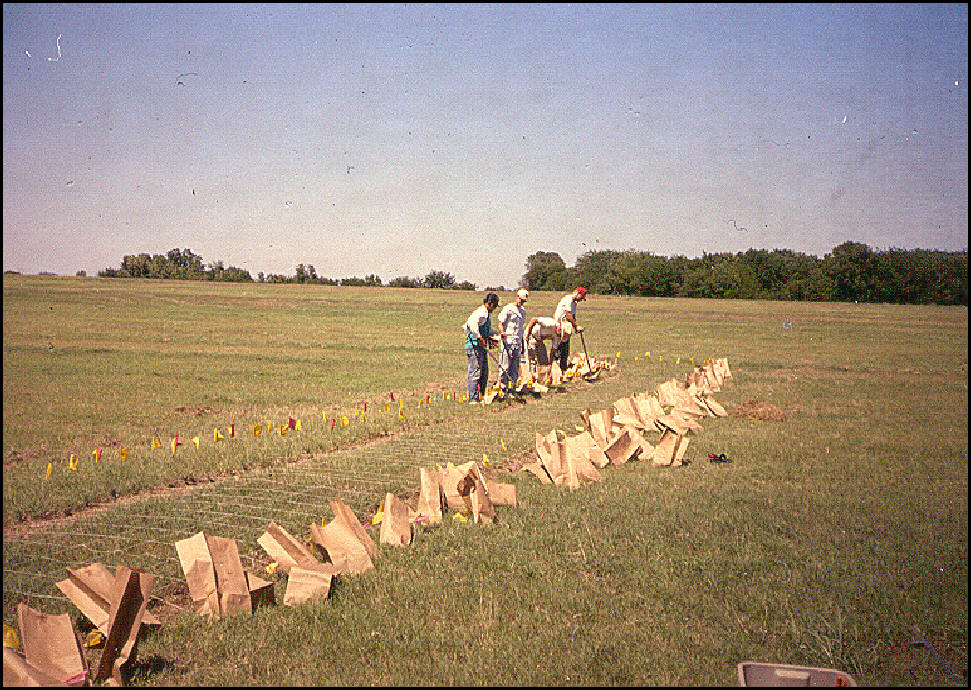
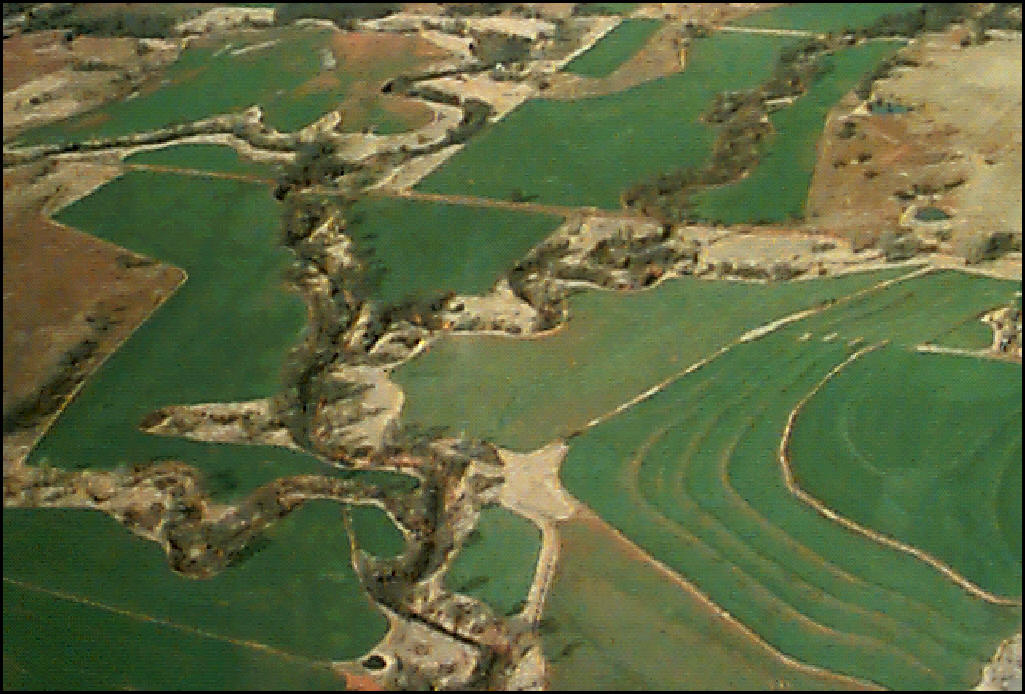

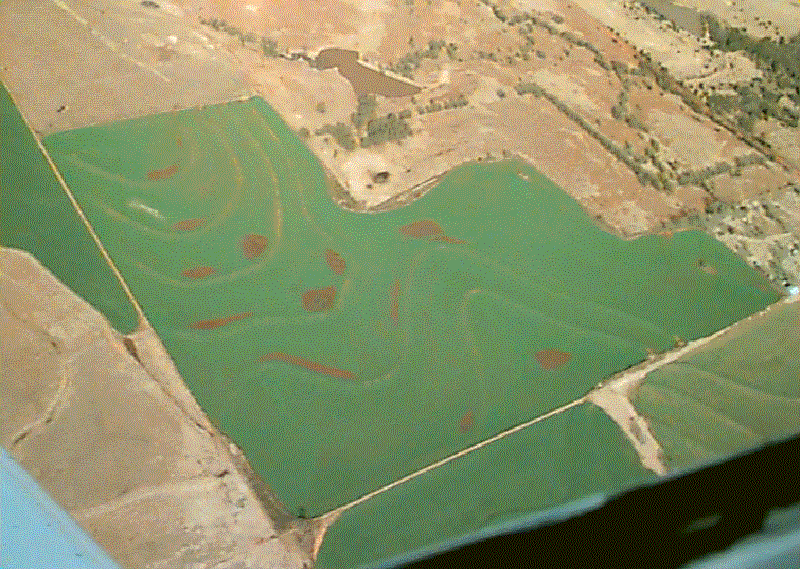
Should precision ag be working at a 1m2 resolution?
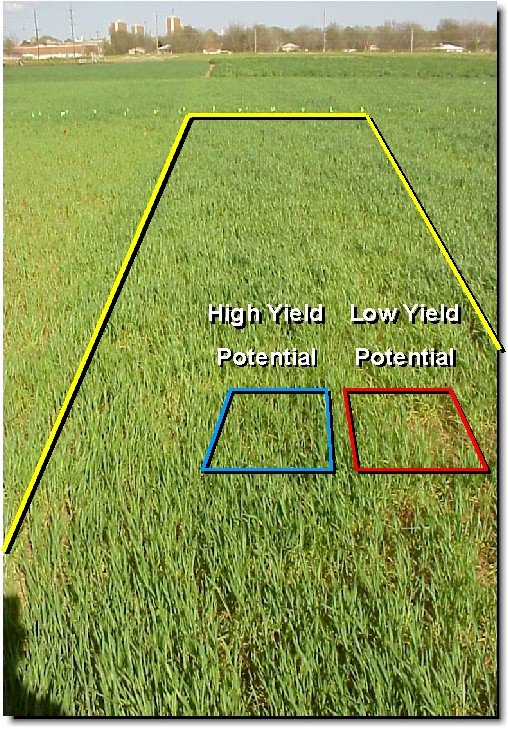
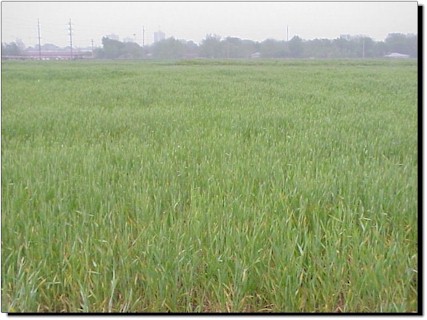
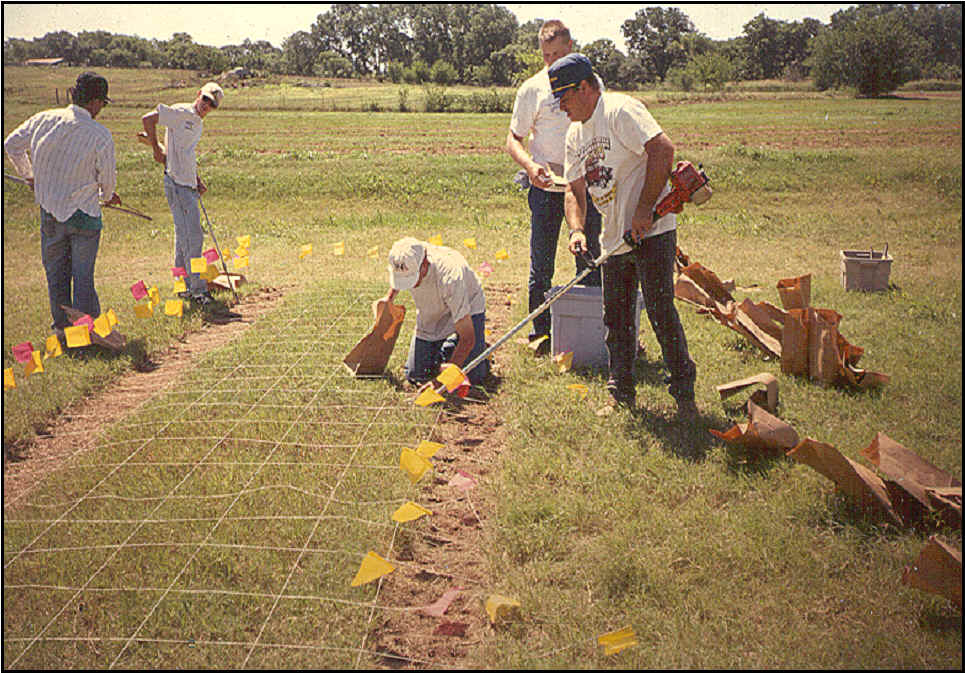
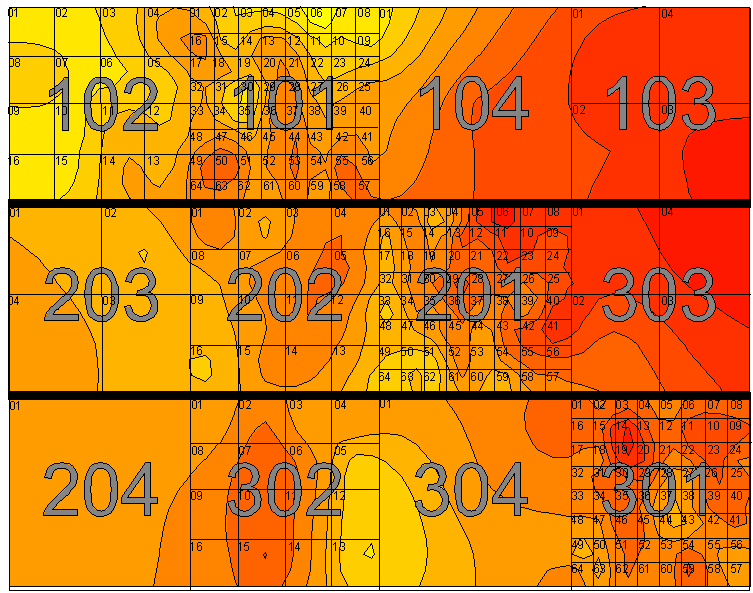
On the left is a picture of one plot (yellow lines) in Experiment #222 that was started in 1969 by Dr. Billy Tucker. This plot has received 80 lbs of N/acre, 60 lbs of P2O5/ac and 40 lbs of K2O per acre for 30 years. Conventional tillage (2 shallow diskings prior to planting) has not changed for 30 years, nor have harvest or straw residue management practices. What is important to note in this picture is that distinct differences in yield potential exist between the two squares (blue and red), less than 3 feet apart. The difference below is not due to planting density or planting error, but rather plant growth. What has caused this difference has not been documented. However, what is important is noting that large differences exist in what should be extremely homogenous areas. The difference between the red and blue squares is one of 'yield potential.' Increasing the topdress N rate in the red square will unlikely result in an equivalent yield as the blue square, even though need is greater. In the future, fertilizing the red and blue squares based on their predicted yield potential will maximize yield and N use efficiency.
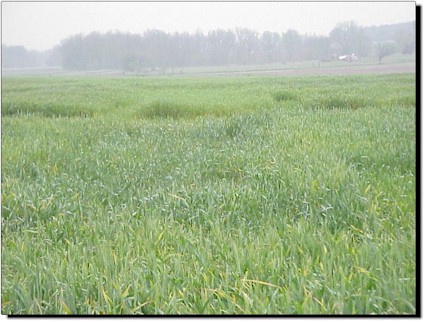
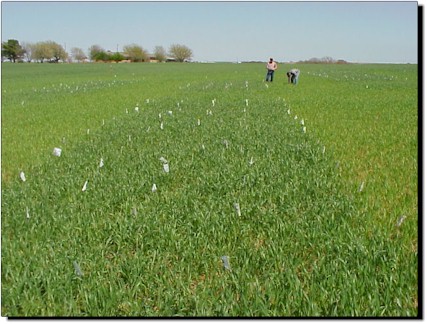
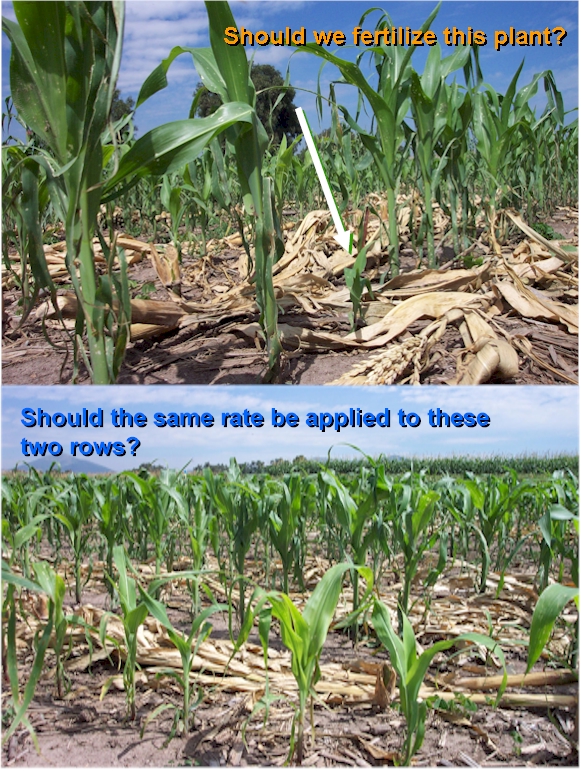
Small-scale variability can be observed in a follow-up picture from Experiment #222 on the right. This kind of small-scale variability can be found in farmer fields all over the world. In the past we have ignored micro-variability in yield, opting to treat fields with one rate and one management practice. In the developing world, treating each 1m2 area with specific rates is possible, largely because most (if not all) field work is accomplished by hand. In the developing world where fertilizer N is applied for grain crop production, much of it is applied by hand, and more importantly, in-season. This allows for visual inspection/calibration of the fertilization process since farmers can easily be taught how to fertilize plants based on predicted yield potential. At this stage, it is unlikely that we can place sensors in the hands of developing nation farmers. However, it would be very easy to place a color coded calibration chart (possibly taped to the farmers arm) for rapid use/reference concerning fertilizer application.
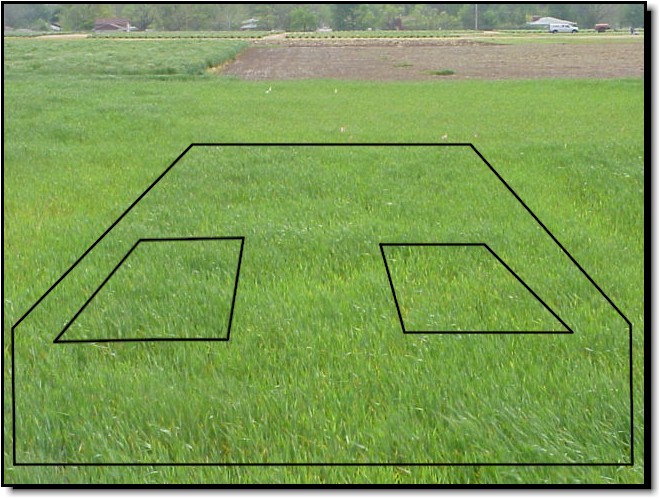
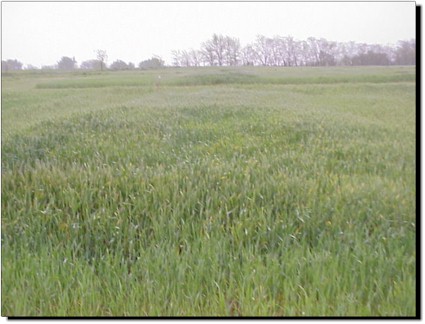
Much of this work is really common sense as related to small scale variability and how this relates to altered yield potential within the same plot. If the plant is bigger, yield potential is higher. If the plant is smaller and starved, yield potential is lower. If color were the same for both large and small plants (e.g., dark green), N fertilization should be higher for the larger plants based on increased yield potential. Programming the fertilization-decision into a mechanical-by-hand process for farmers will be cumbersome. However, if developing nation farmers continue to apply fertilizers by-hand, this should be an achievable objective, and highly likely to result in increased yield and use efficiency.
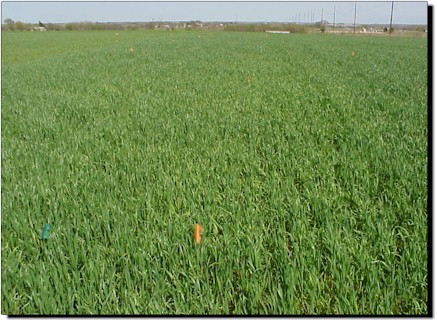
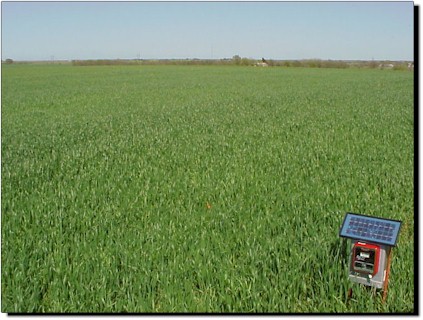
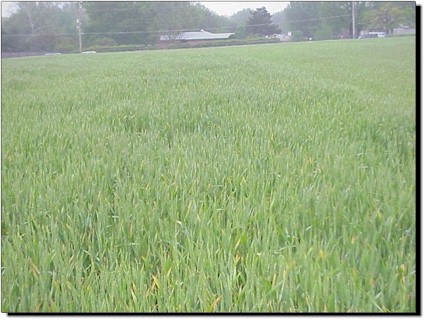
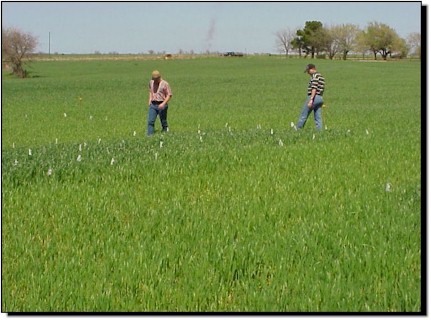
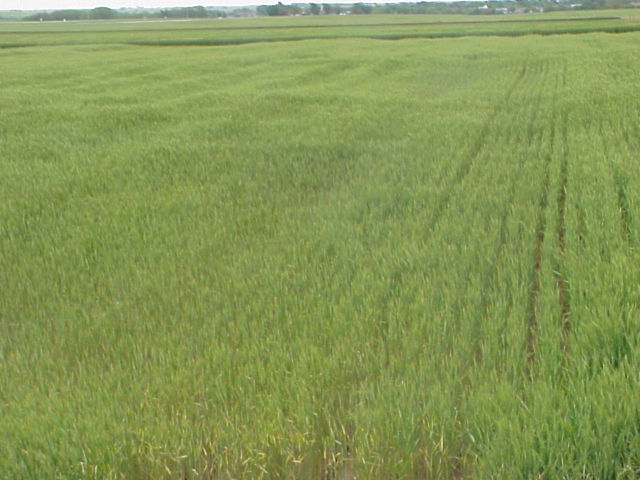
Only limited forage yield response to fertilizer N applied in early March, using INSEY was apparent at this site (right and bottom picture, Morrison, OK, April 8, 1999)
