 Precision
Sensing CES Workshop, January 18-19, 2005 Precision
Sensing CES Workshop, January 18-19, 2005 |
|
|
|
January 18, 2005 |
|
|
LOCATION: Biosystems and Agricultural
Engineering lab building just east of the Colvin Center and South of
the OSU track |
|
8:00-8:45 |
Resolution
and Scale of Measurements, Bill Raun, John Solie |
|
8:45-9:30 |
Radiometric Theory & Vegetative Indices,
John Solie |
|
9:30-10:15 |
N Rich Strips,
Bill Raun
*Maximum Yield Potential
*Predicting Fertilizer Response |
|
10:15-10:30 |
BREAK |
|
10:30-11:15 |
Components of
the Nitrogen Fertilization Optimization Algorithm (NFOA), Bill Raun |
|
11:15-12:00 |
Sensor Based
Nitrogen Rate Calculator, Web Based Calculation of Whole Field Topdress N
Rates, Bill Raun |
|
12:00-12:40 |
LUNCH |
|
12:40-2:30 |
Training on the Use of Hand-Held Sensor (IPAQ,
data collection, data management) |
|
2:30-3:00 |
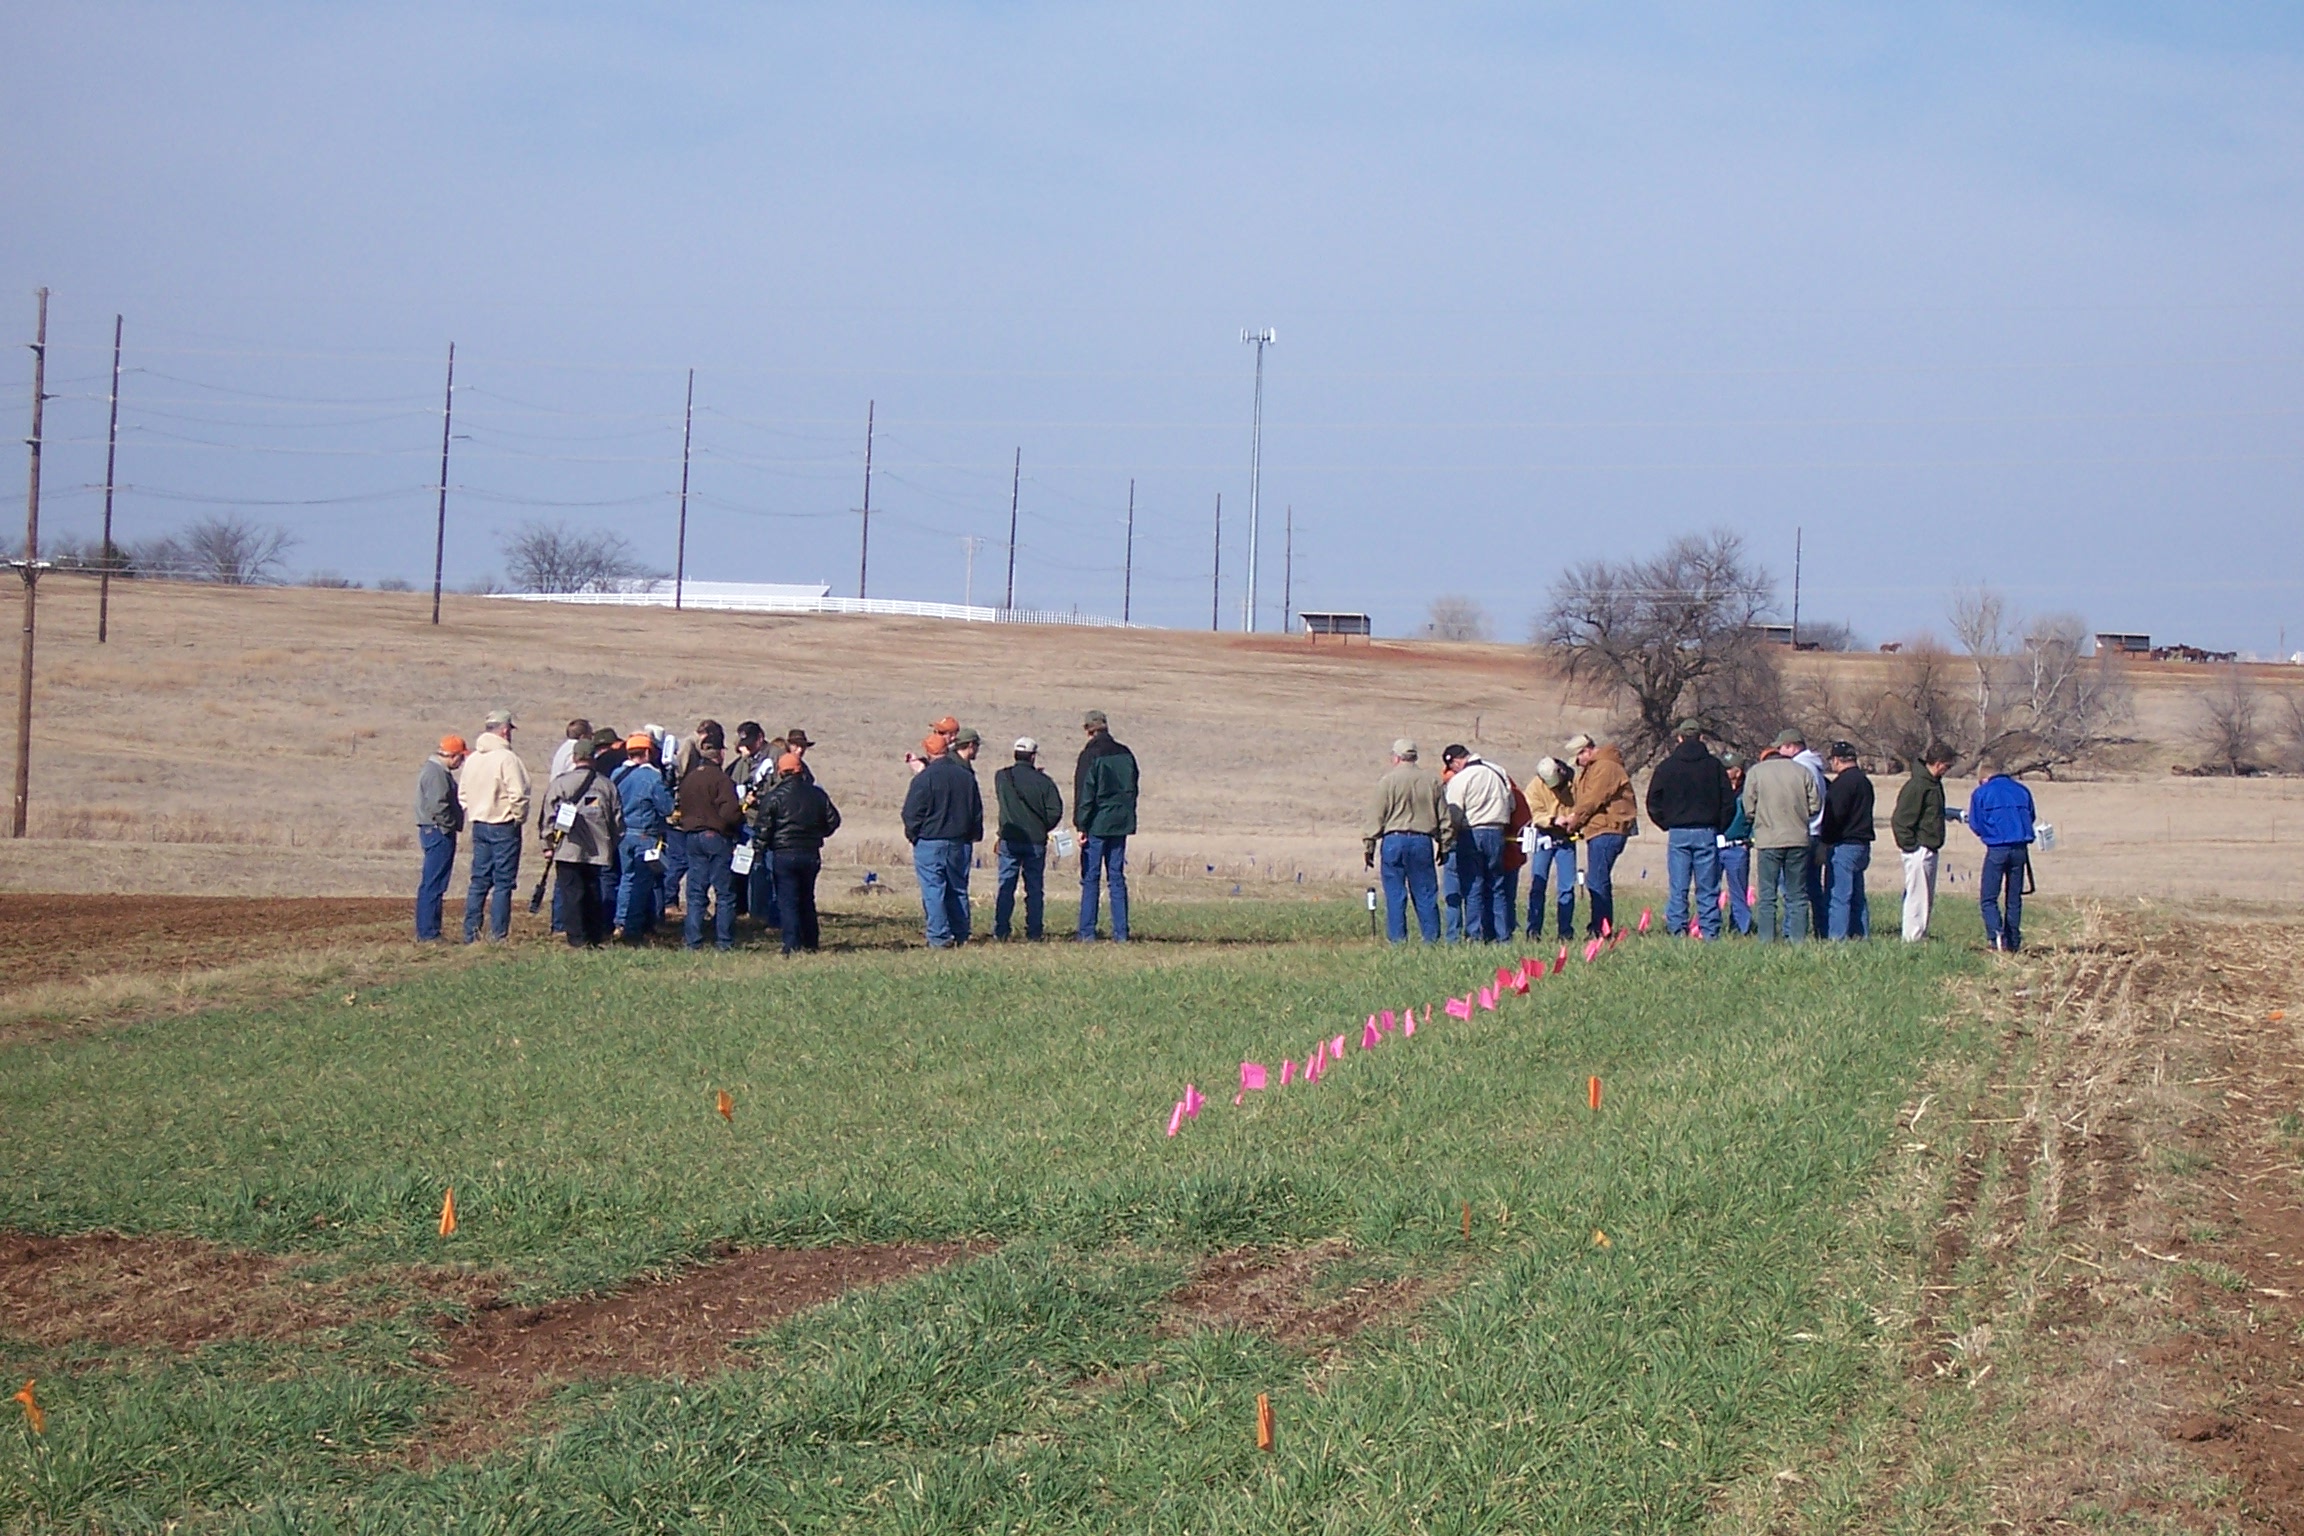
N Rich Strips (Field Exercise explanation)
|
|
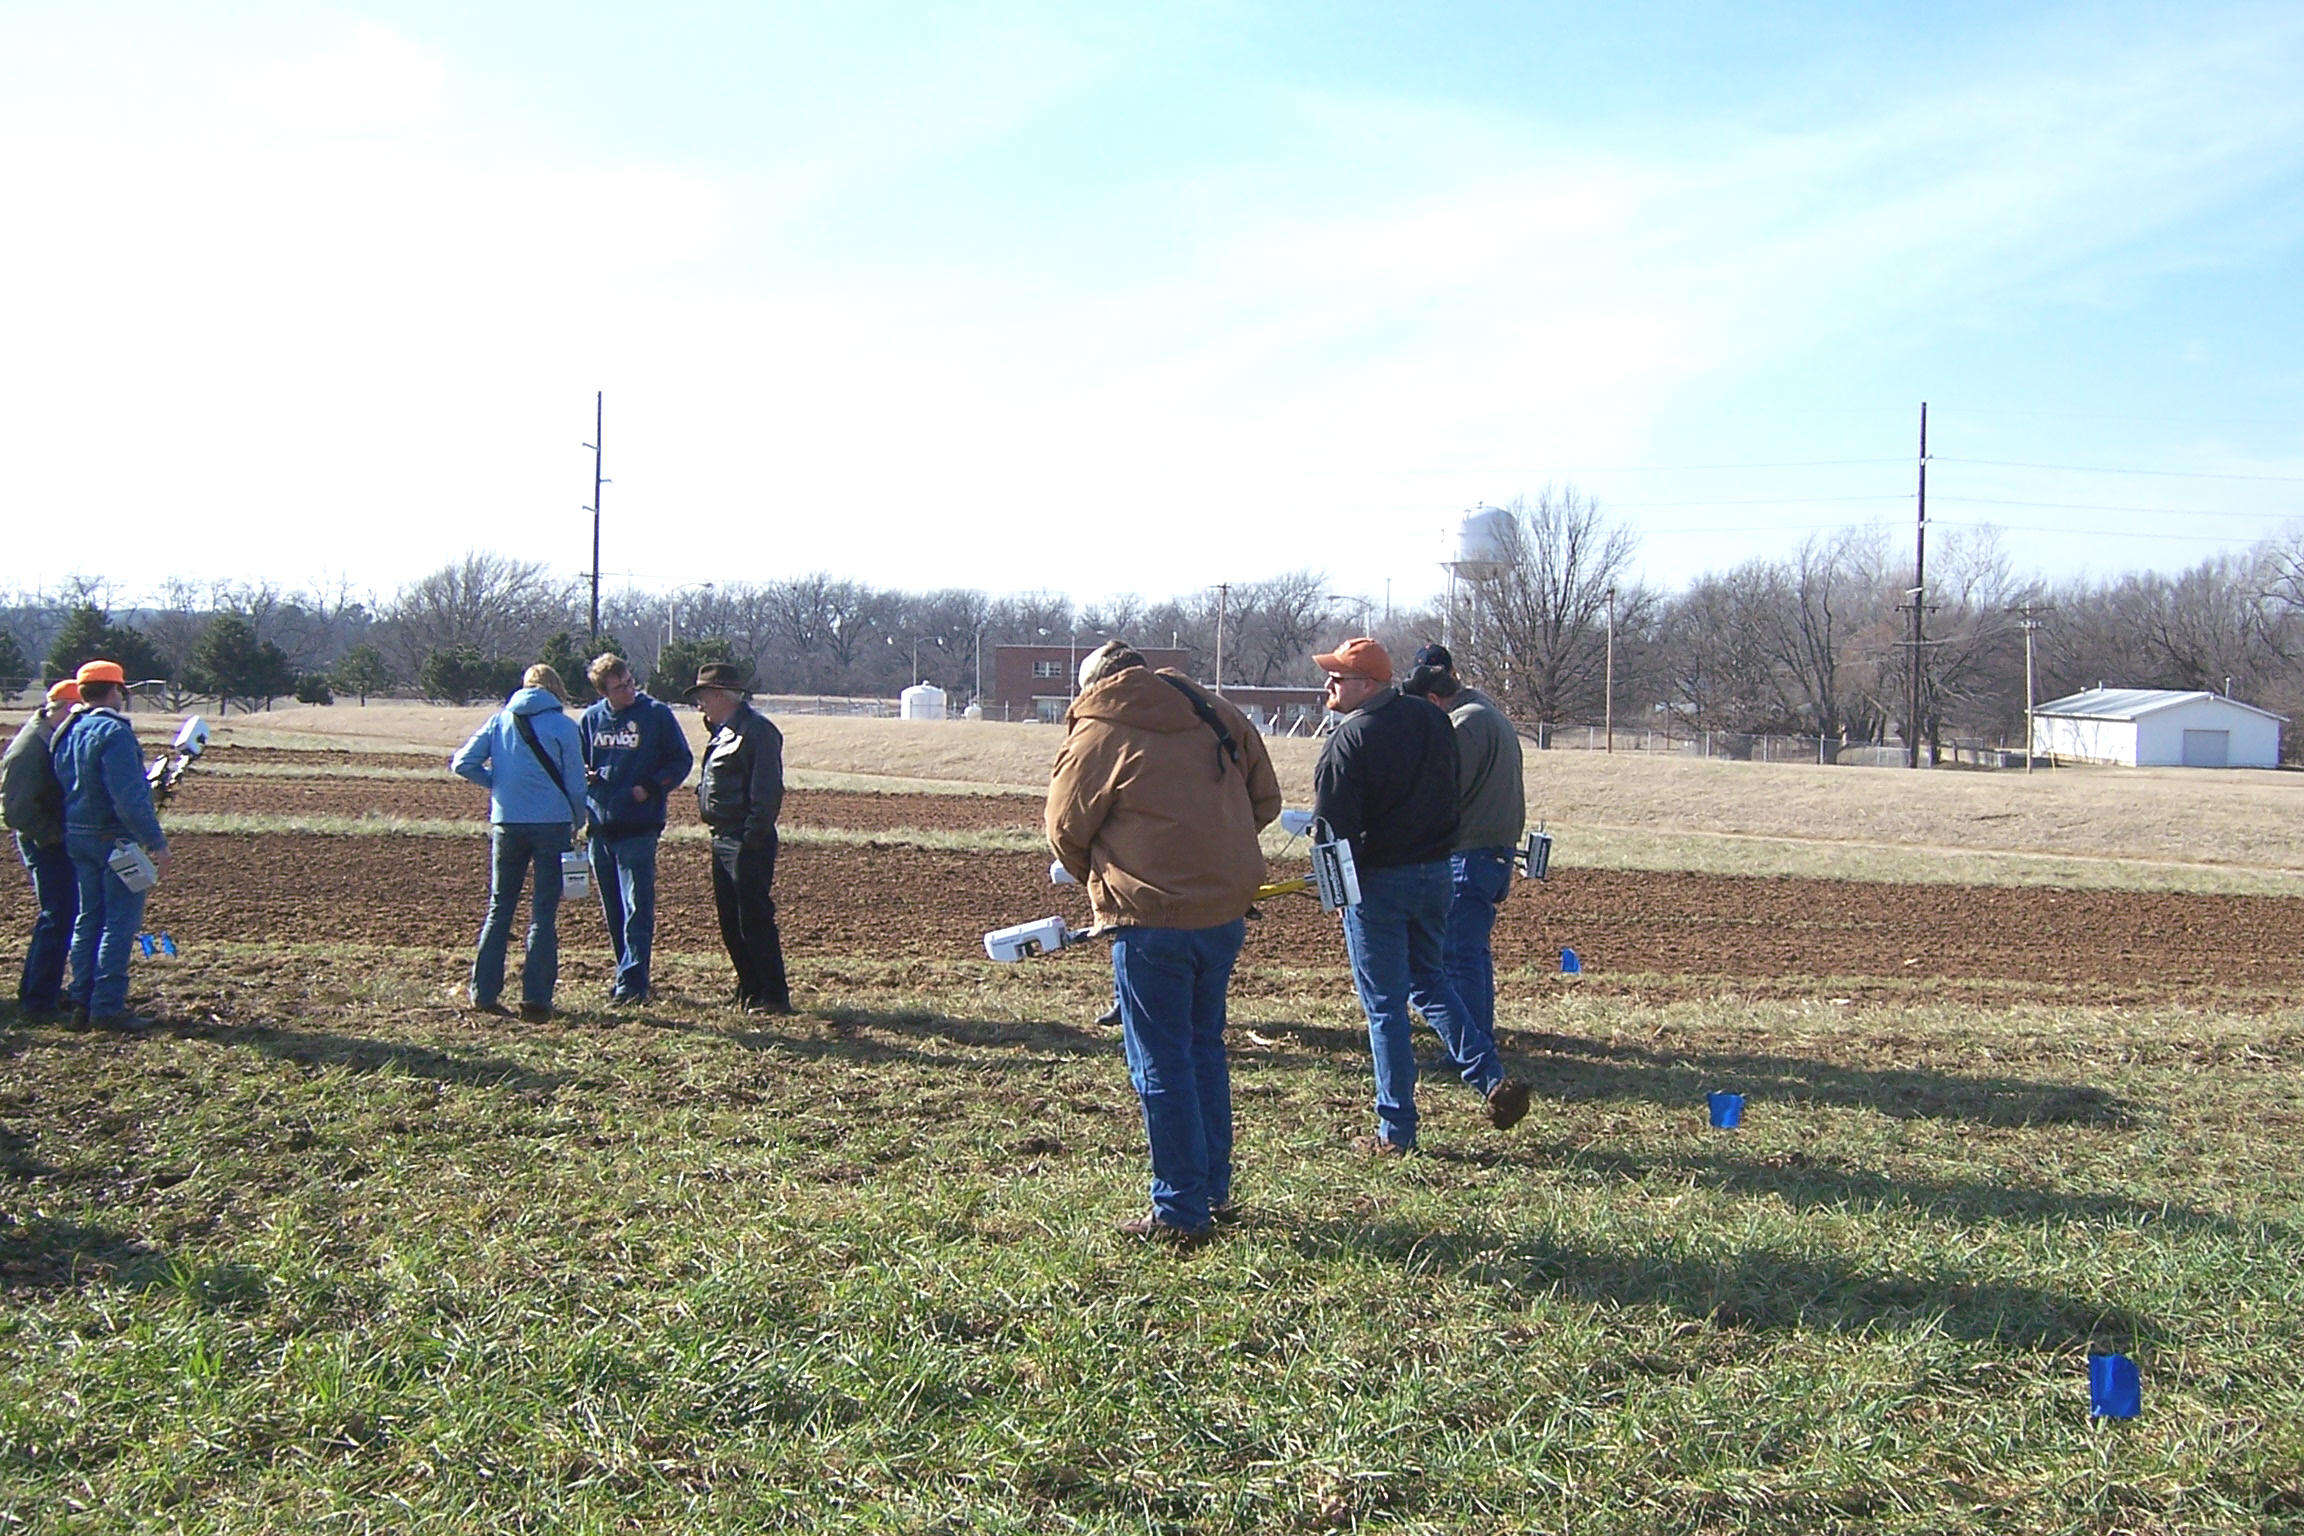
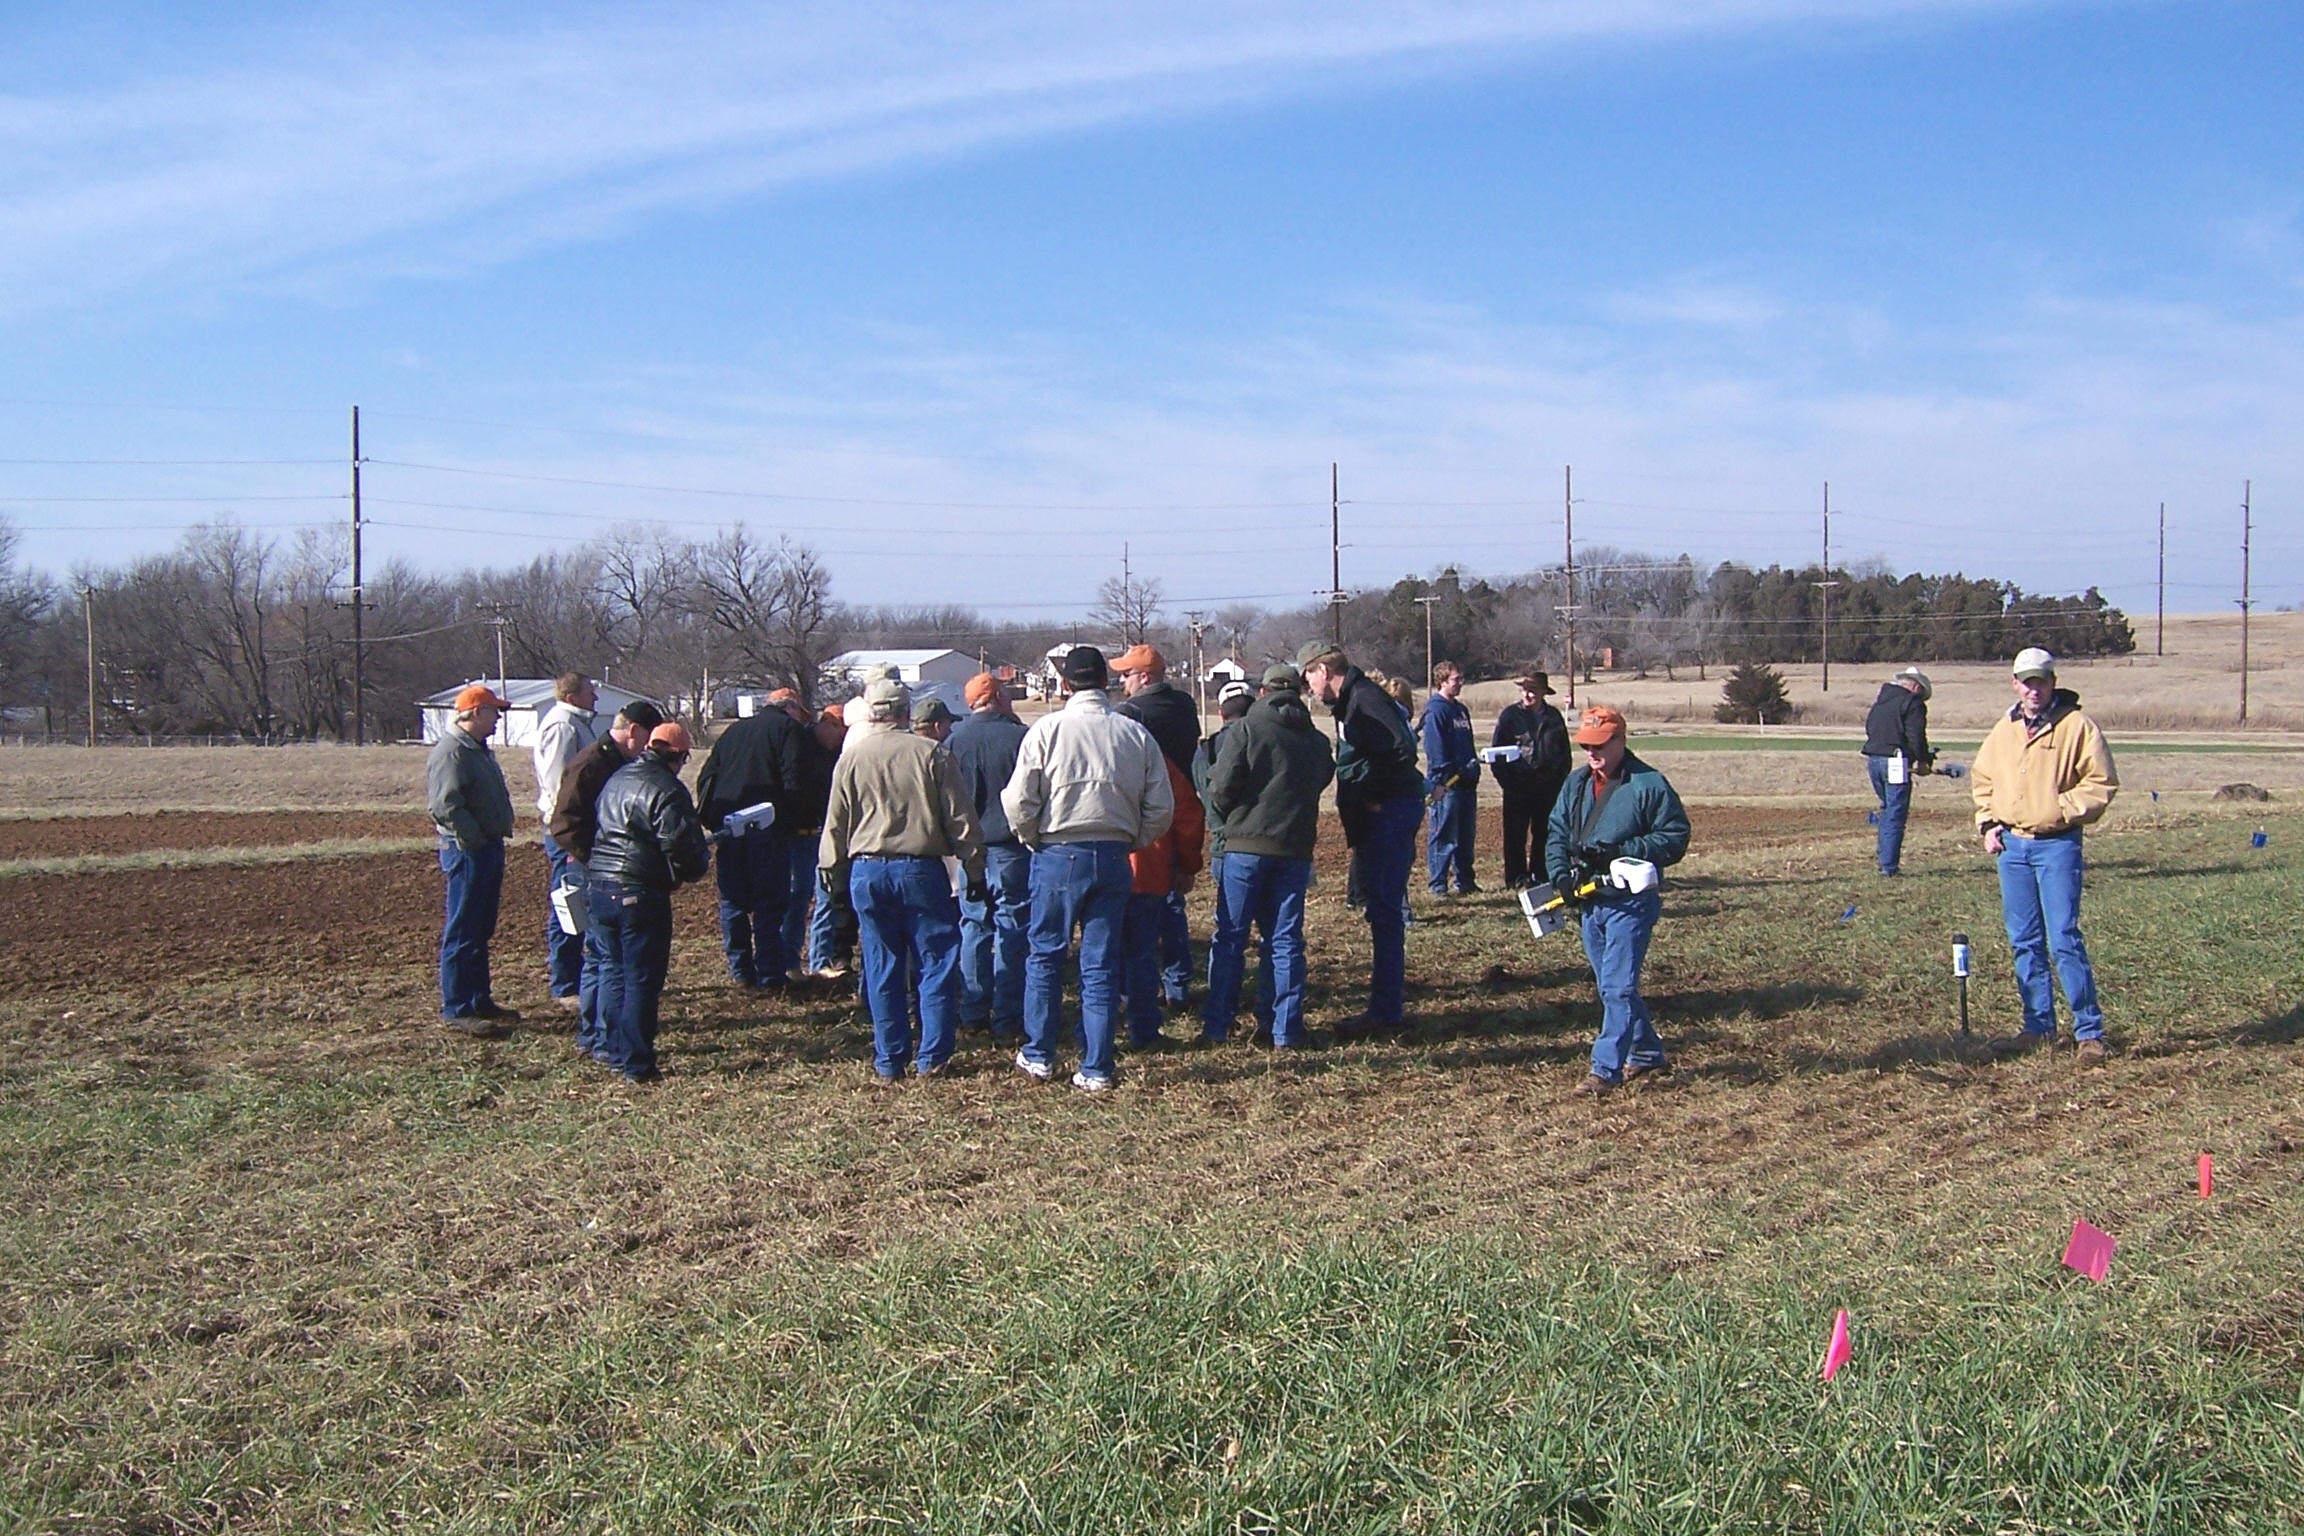
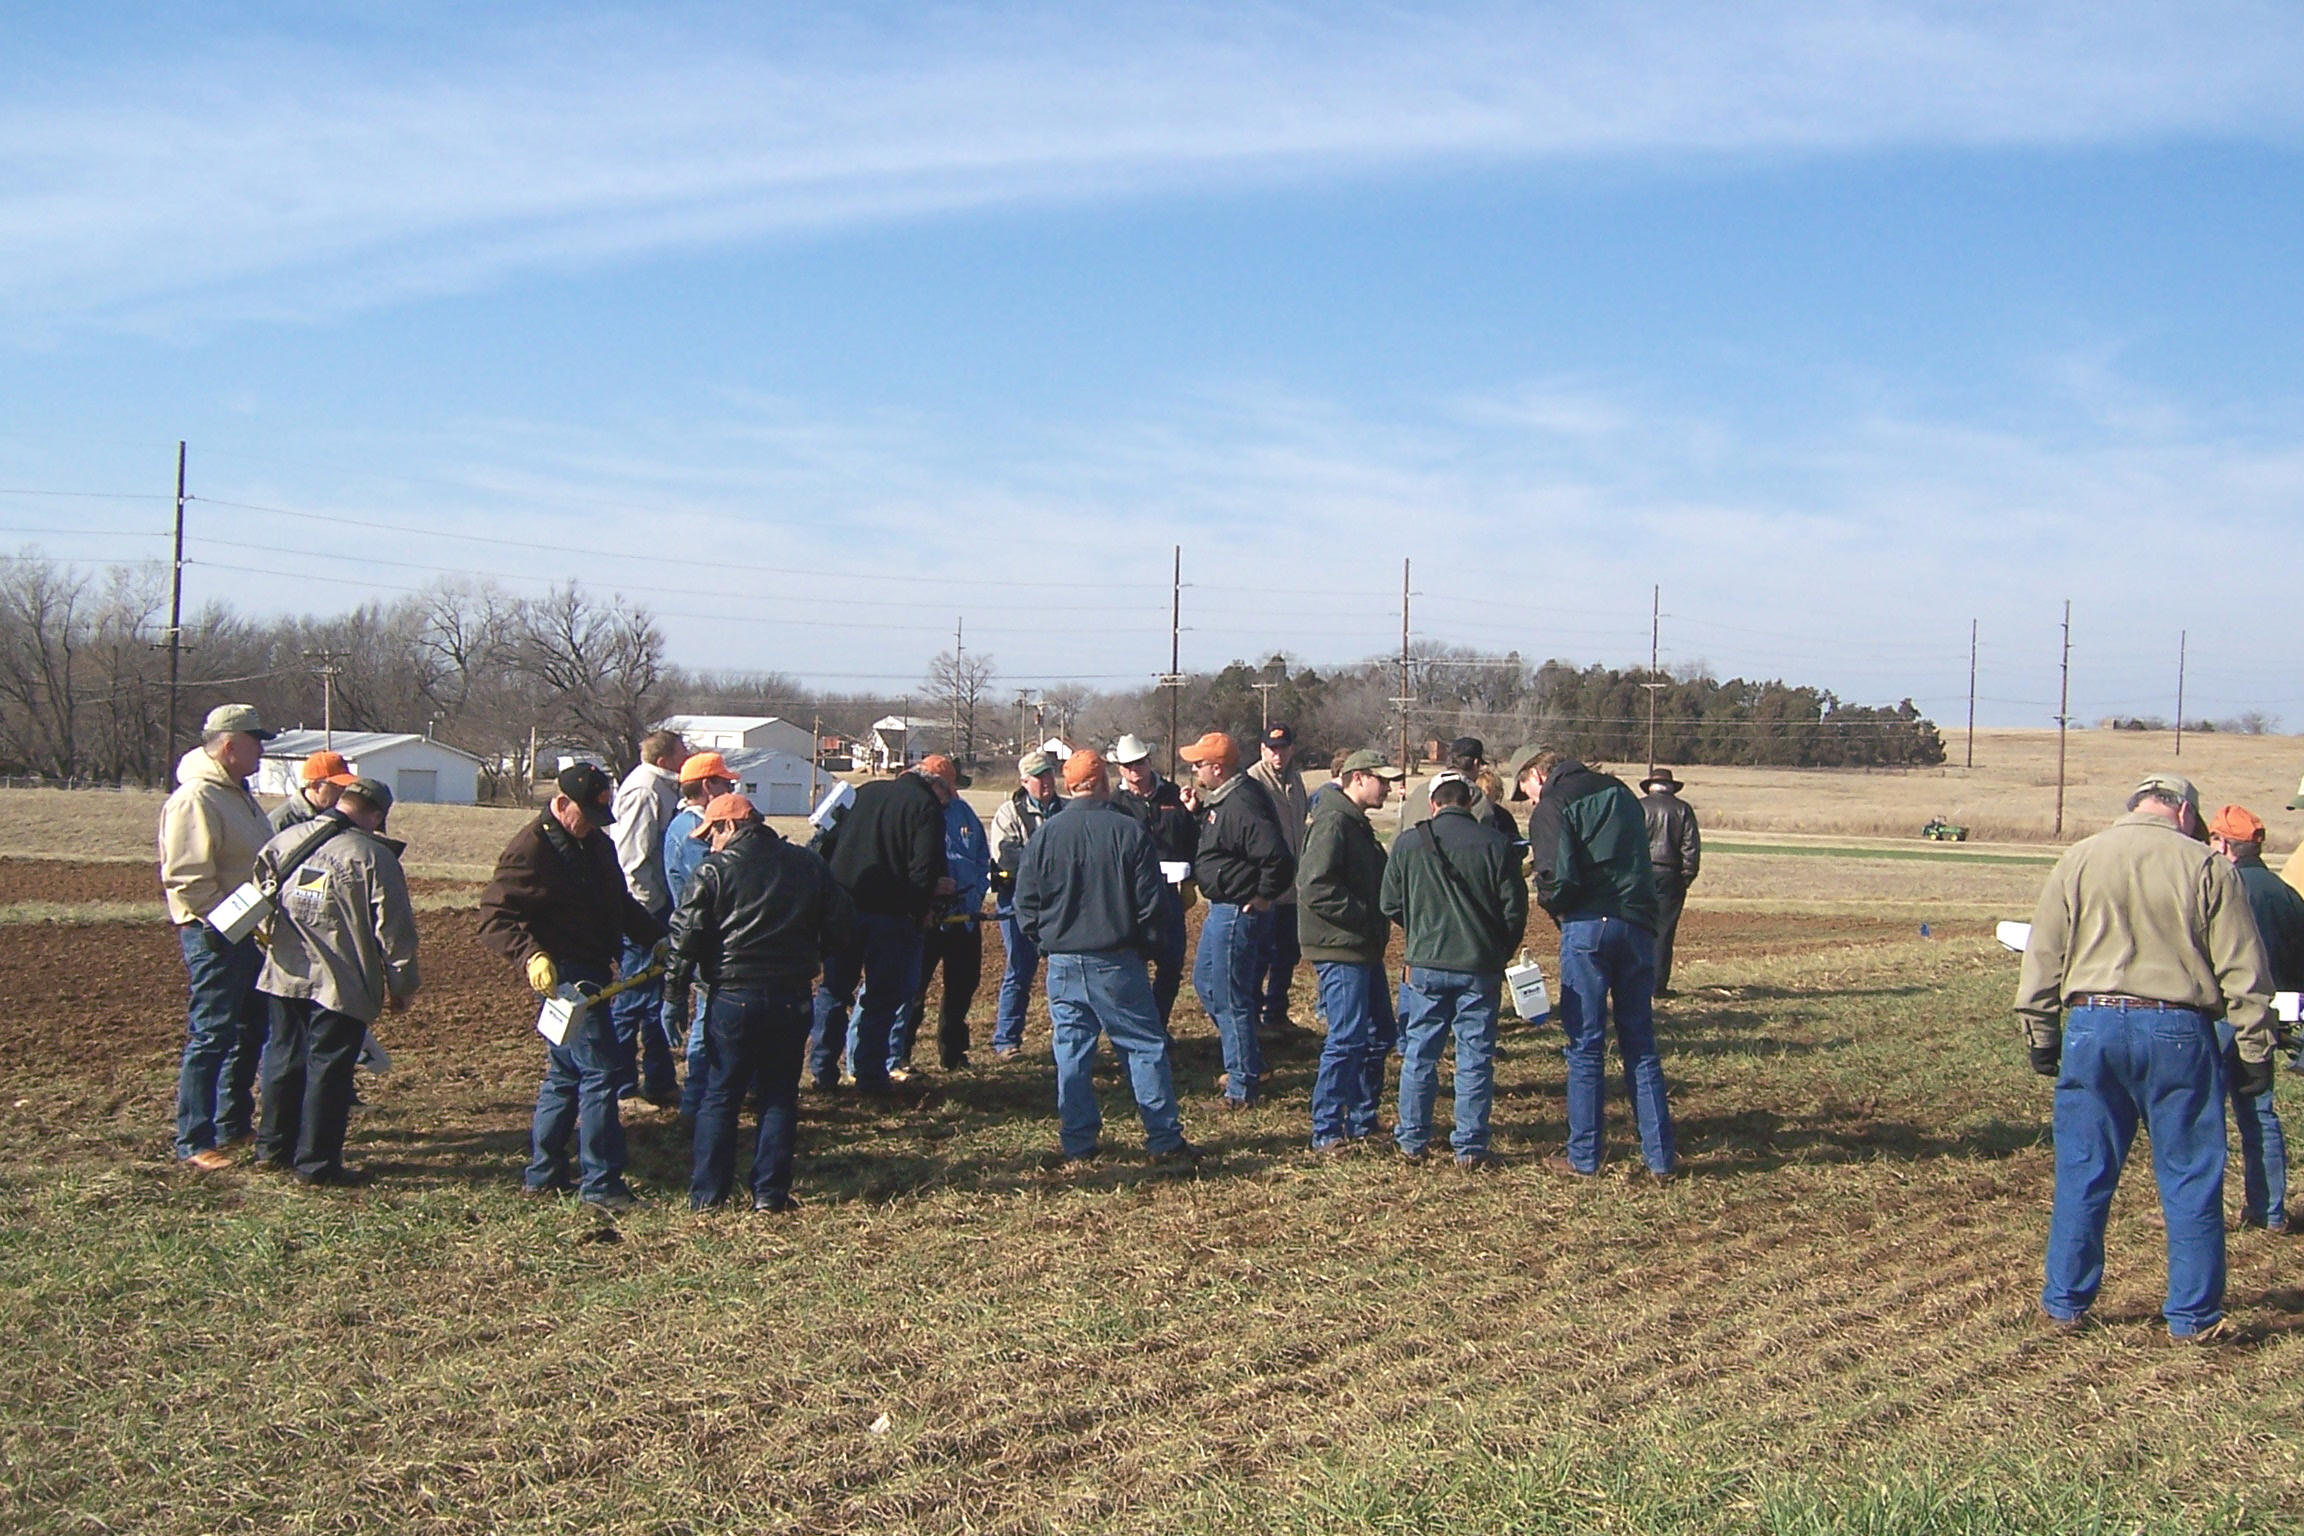
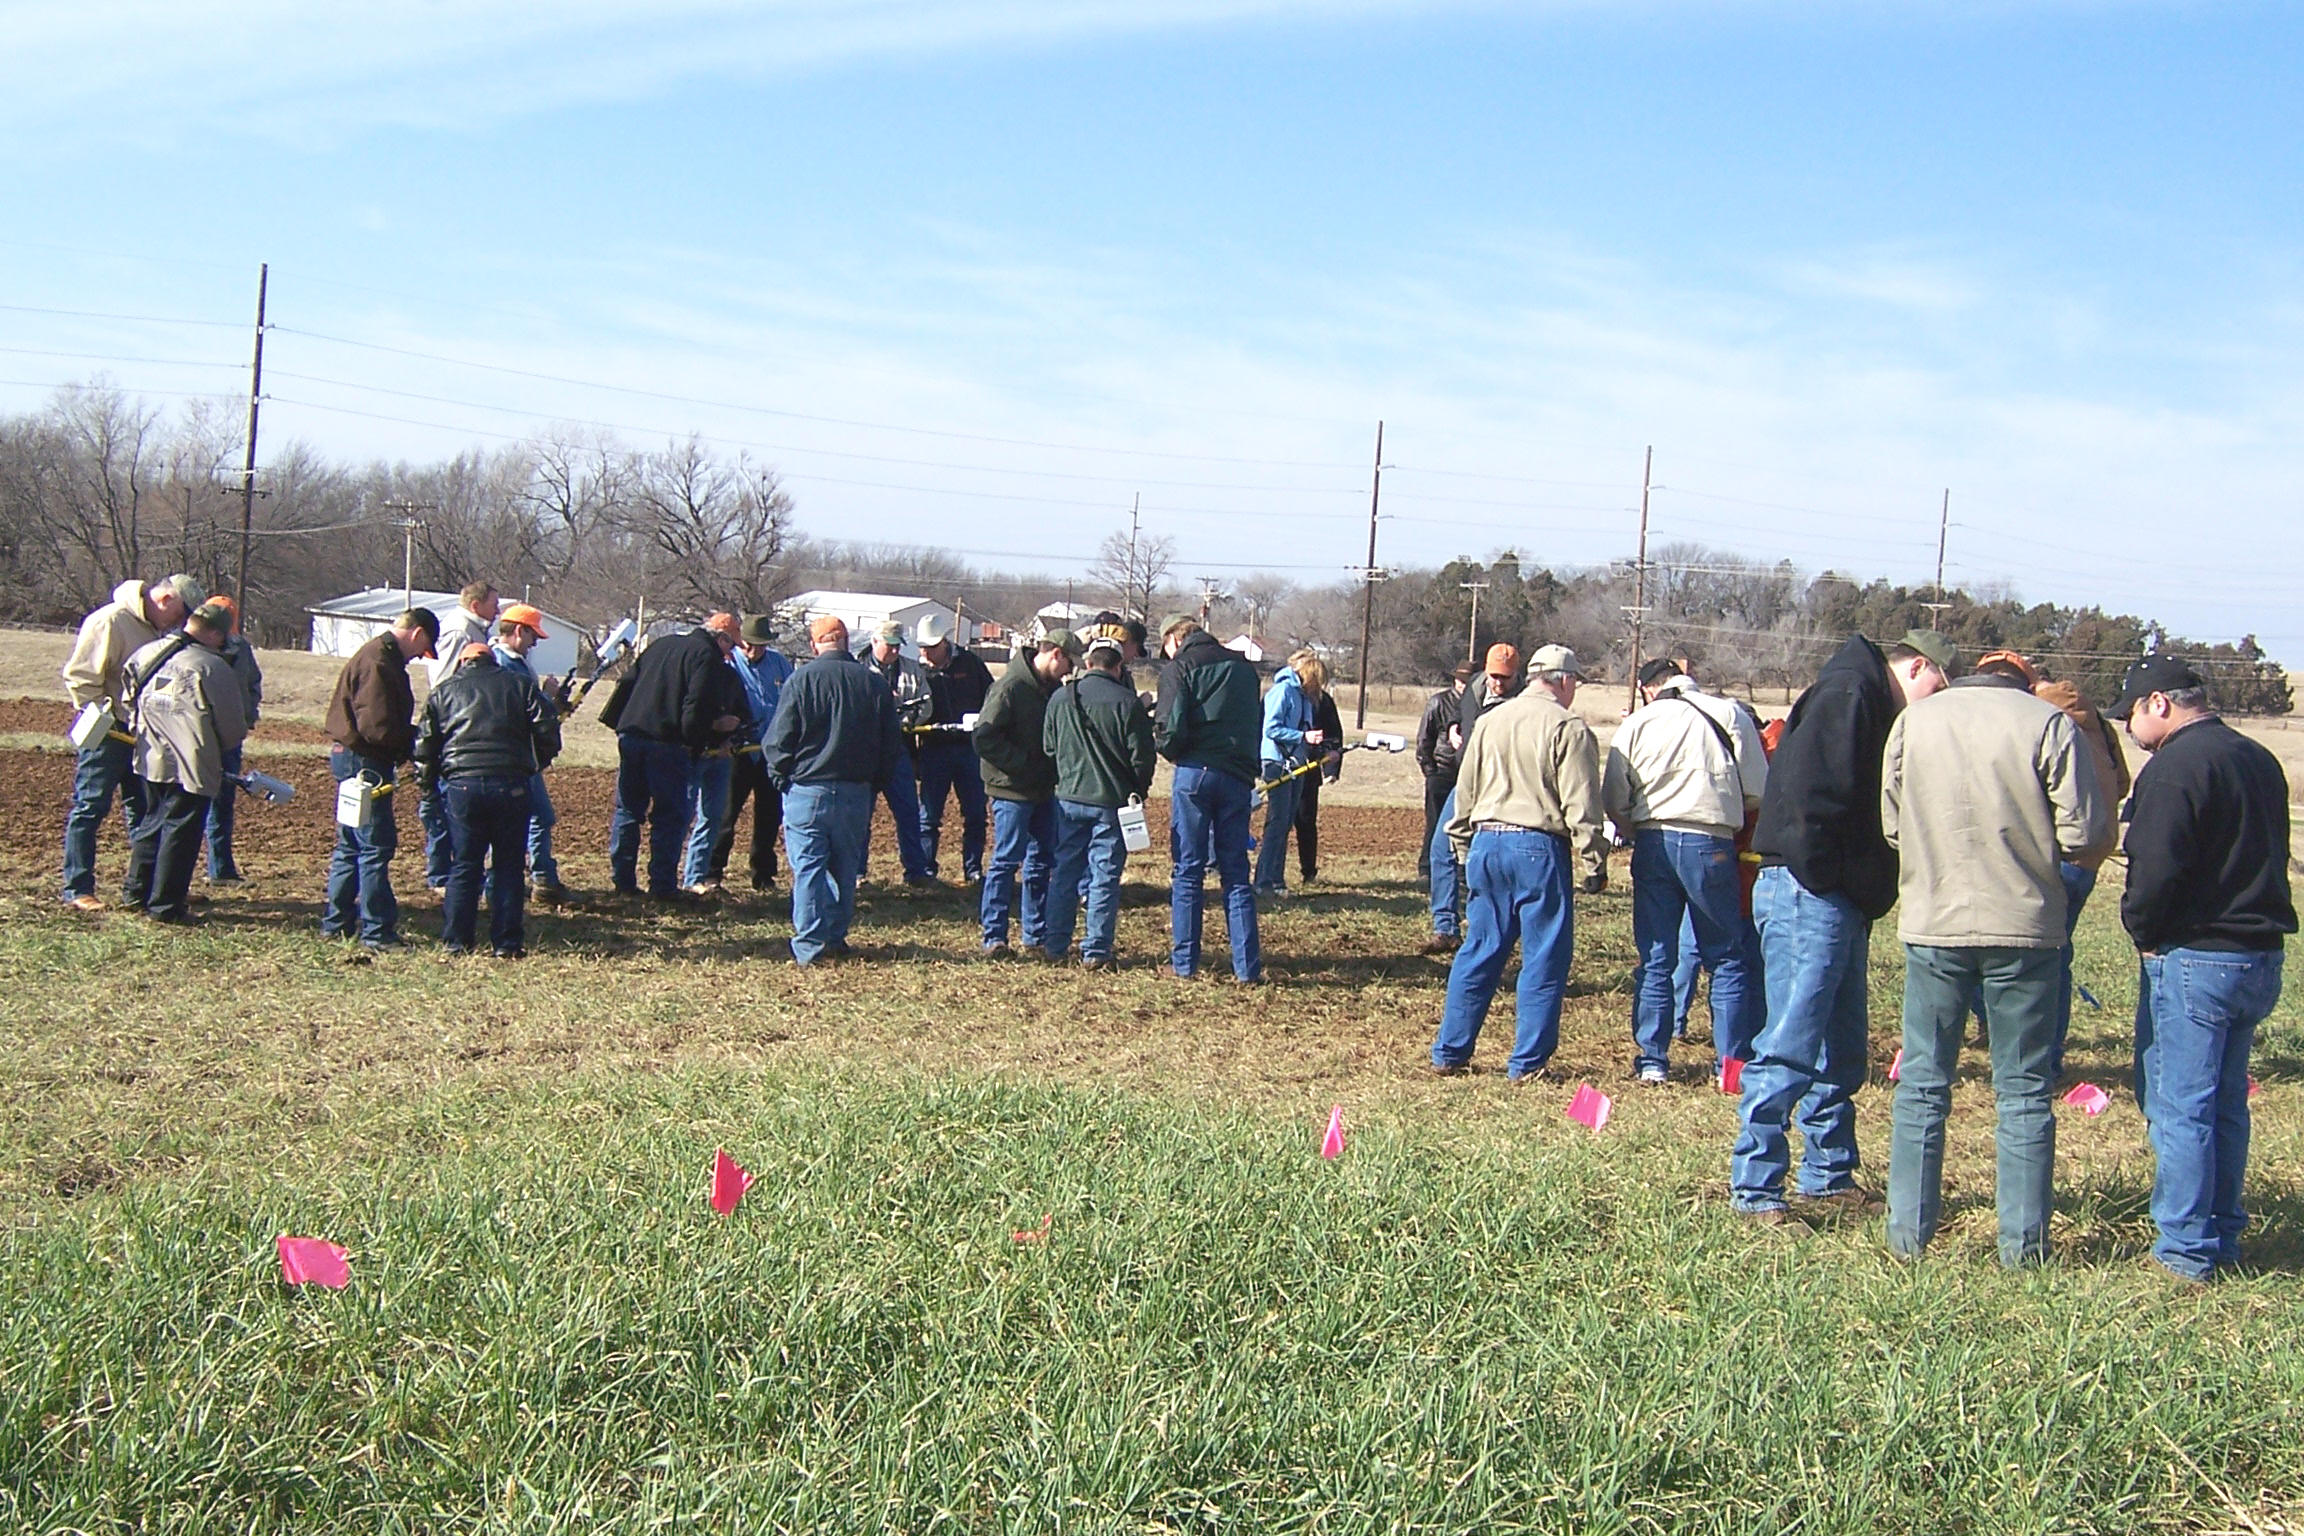
3:00-4:00 |
Travel to Experiment #222, and collect data
for the Field Exercise |
|
4:00-5:00 |
Data Interpretation, added Examples for
On-Line Algorithms (BIOEN Computer Lab) Bill Raun, John Solie
*Use of IPAQ Program for N Rate Recommendations |
|
|
|
|
January 19, 2005 |
|
|
LOCATION: 210 Agricultural Hall
|
|
8:15-9:30 |
Calibration Stamps, Bill Raun, John Solie
Addendum (Solie) |
|
9:30-10:15 |
Yield Potential Prediction for Various Crops, Refining Regional
Algorithms, Bill Raun |
|
10:15-11:00 |
Treating Temporal and Spatial Variability (VRT
Applicator), John Solie |
|
11:00-12:00 |
GPS and Mapping, John Solie |
|
12:00-12:15 |
Wrap Up |
|
12:15-1:00 |
LUNCH |
|
|
|
|
|
|
|
ADDED REFERENCES |
         |
|
1.
Spatial Variability in Precision Agriculture
2.
Resolution
Determination, J. Solie
3.
History of Indirect
Measures, W. Raun
4.
Descriptive Statistics
5.
History of Predicting Yield Potential, N Response and N Rates W. Raun
6. GIS, J. Solie
7. Sampling Strategies, J.
Solie
8.
Remote
Sensing, J. Solie
9.
Satellite Management, J.Solie |
|
|