Predicting
the Potential Response to Applied N (Response Index) Using
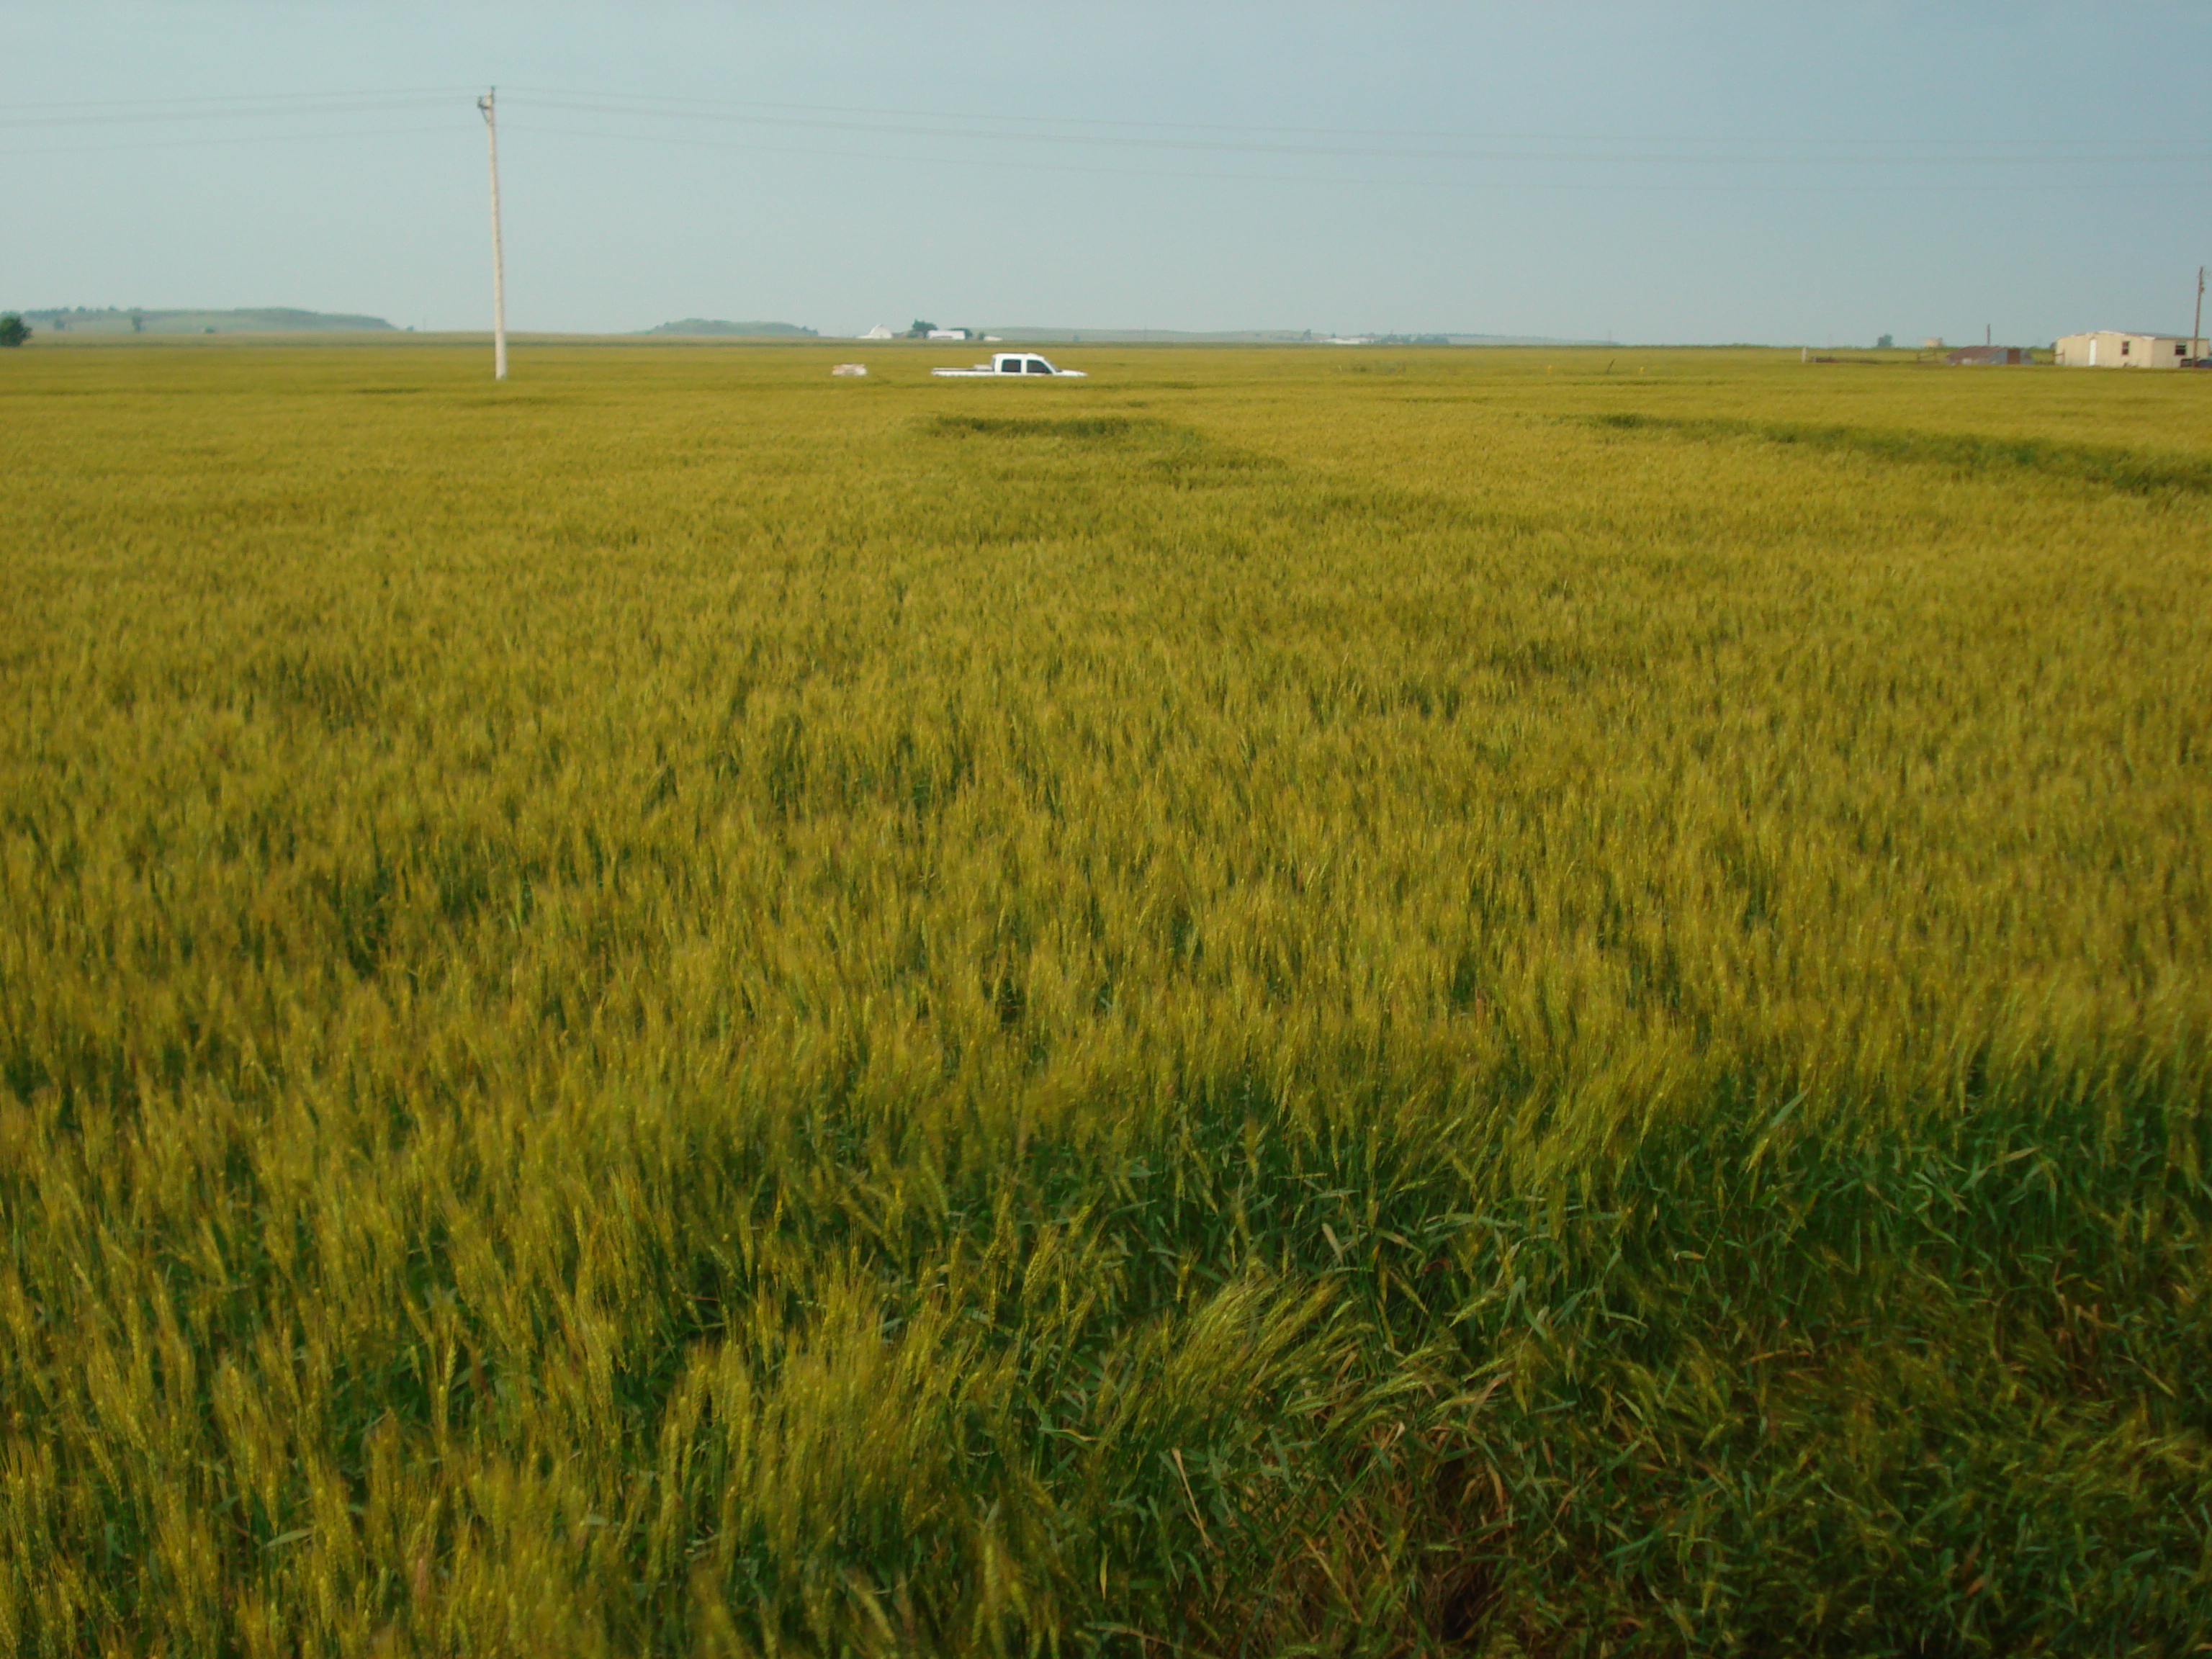
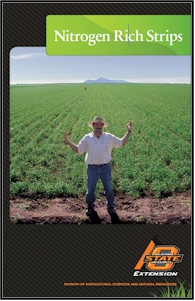
Nitrogen Rich Strips
Predicting
the Potential Response to Applied N (Response Index) Using
Nitrogen Rich Strips Also see Ramp Calibration Strips
 Dhital,
Sulochana and William Raun. 2016. Variability in optimum N rates for maize
in the Central Great Plains.
Dhital,
Sulochana and William Raun. 2016. Variability in optimum N rates for maize
in the Central Great Plains. Variability in Optimum Nitrogen Rates for Maize. Agron. J. 108:2165-2173.
(doi:
Wheat N Rich Strips for Corn
Early work where N Rich Strips were called 2X Strips
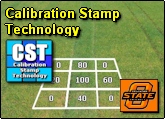
Calibration Stamps
Automated Calibration Stamp Technology for Improved In-Season Nitrogen Fertilization Agron J. 97:338-342. (pdf)
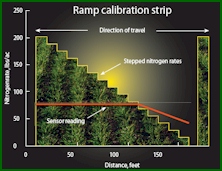
Wheat N Ramps
Ramp Calibration Strip Technology for Determining Midseason Nitrogen Rates in Corn and Wheat. Agron . J. 100:1088-1093.

Wheat Nitrogen Ramps
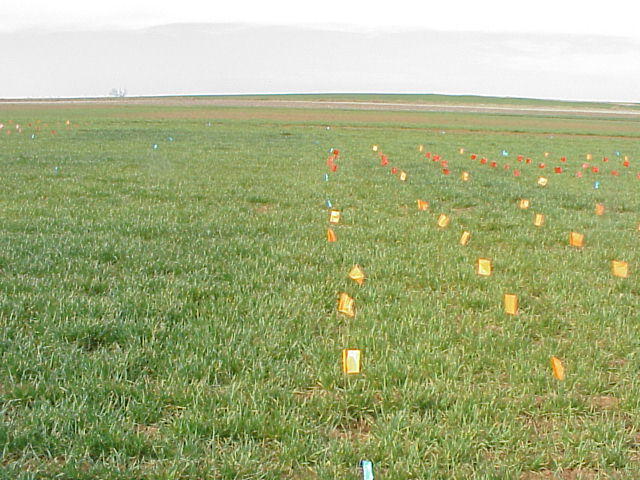
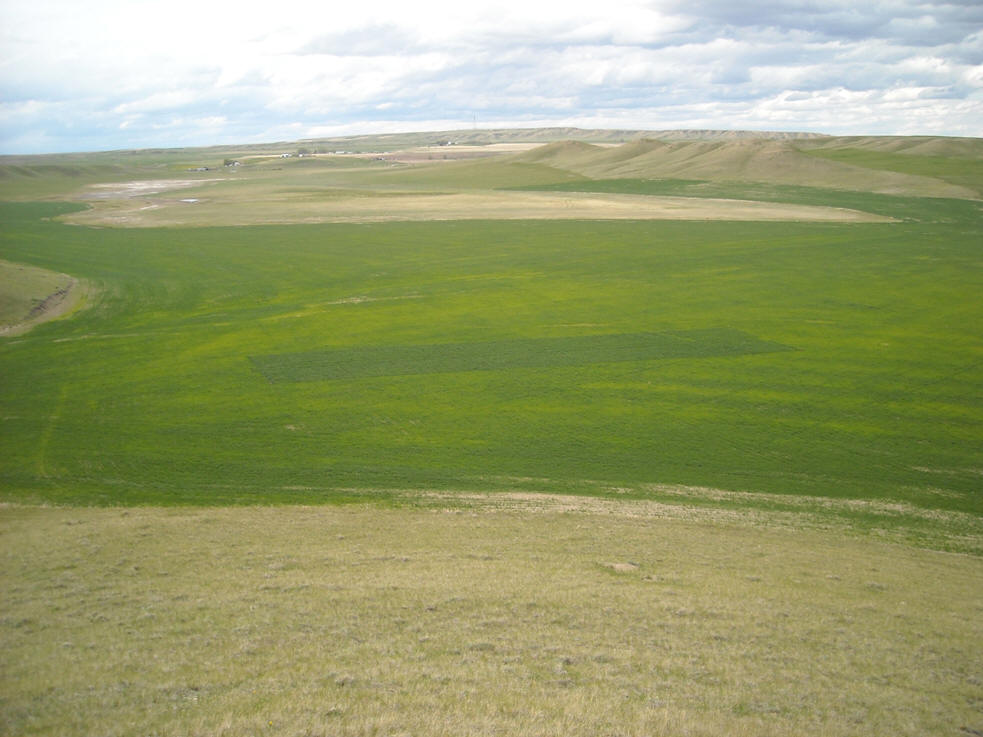
N Rich Strip, Montana
INDICATOR CROPS
![]() Optical Sensor Based Algorithm
for Crop Nitrogen Fertilization Commun. Soil Sci. Plant Anal.
36:2759-2781
Optical Sensor Based Algorithm
for Crop Nitrogen Fertilization Commun. Soil Sci. Plant Anal.
36:2759-2781
![]() Automated
Calibration Stamp Technology for Improved In-Season Nitrogen
Fertilization
Agron J. 97:338-342
Automated
Calibration Stamp Technology for Improved In-Season Nitrogen
Fertilization
Agron J. 97:338-342
The demand for fertilizer nitrogen changes from year to year, even in
long-term plots where the same fertilizer N rates are applied each year.
When winters are wet and warm, sufficient N can be mineralized from soil
organic matter, and enough to nearly meet the demands for maximum yields
(see 1973, 1979, 2001, and 2005)(Figure 1). In these years, this
is compounded by increased N deposition in the rainfall. Our
long-term winter wheat data confirms that the demand for N is variable
from year to year, and that is unpredictable. This exact same
phenomenon was observed in the RC-RS long-term corn experiment conducted
by the late Professor Robert A. Olson at the University of Nebraska
where near maximum yields in the check plot were produced in 1978
(Figure 2). Where did all the N come from if these check plots had
not been fertilized for nearly 10 years? The answer is N
mineralization via an extremely wet and warm spring-summer.
The influence of temporal variability on the need (or lack thereof) for fertilizer N is huge, yet our fertilizer N rate recommendations seldom account for this. Soil testing (NH4-N and NO3-N) works, but when collected preplant, applying a static value on N demands that will become dynamic mid-season, makes no sense. For precisely this reason, we have developed methods that account for the influence of temporal variability on N demands, by making better fertilizer N decisions mid-season when the growing crop can tell us precisely how much N was delivered for free (comparison between the N Rich Strip and the Farmer Practice, mid-season).
The GreenSeeker sensor via NDVI measurements provides a highly accurate estimate of plant biomass, as a result, total N uptake can be estimated from mid-season measurements. More importantly, yield potential can be predicted mid season using both sensor and known climatic data from planting to sensing. By estimating yield, we can then estimate total grain N removed. Yield potential (YP0) is then multiplied times the response index (estimated in-season from NDVI readings collected in the N Rich Strip and Farmer Practice) to obtain the yield obtainable if N fertilizer is to be applied (YPN). The fertilizer N rate is determined by subtracting N uptake at YP0 from N uptake at YPN, and divided by an expected NUE. This entire algorithm is completely delineated in the "Optical Sensor Based Algorithm" article below.
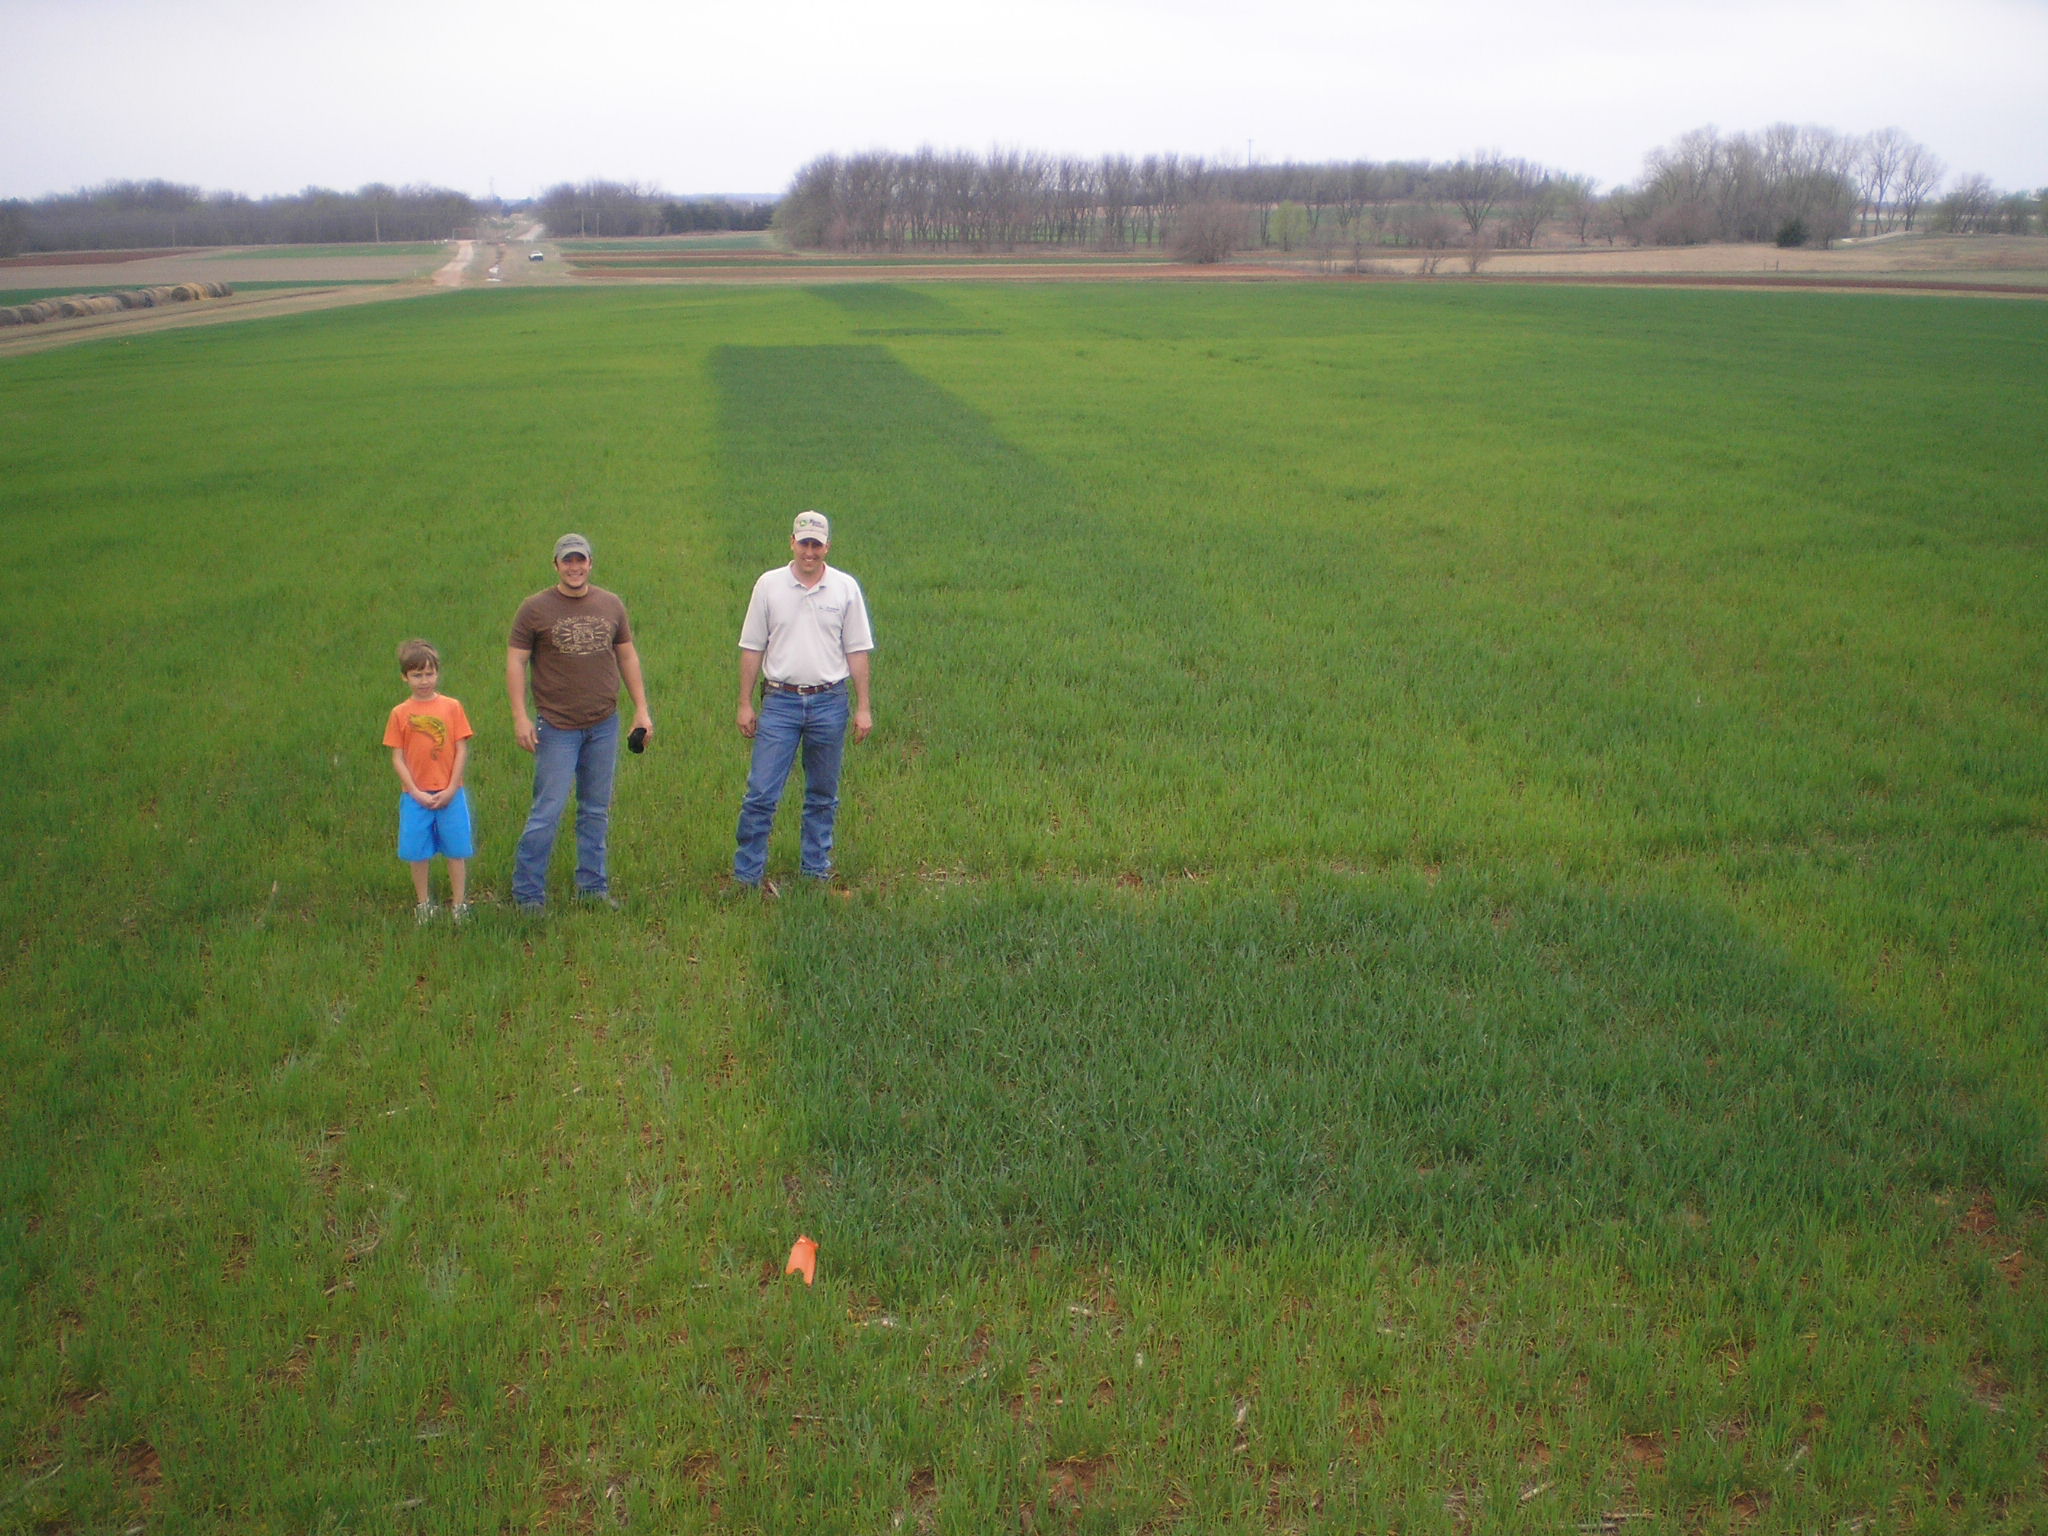
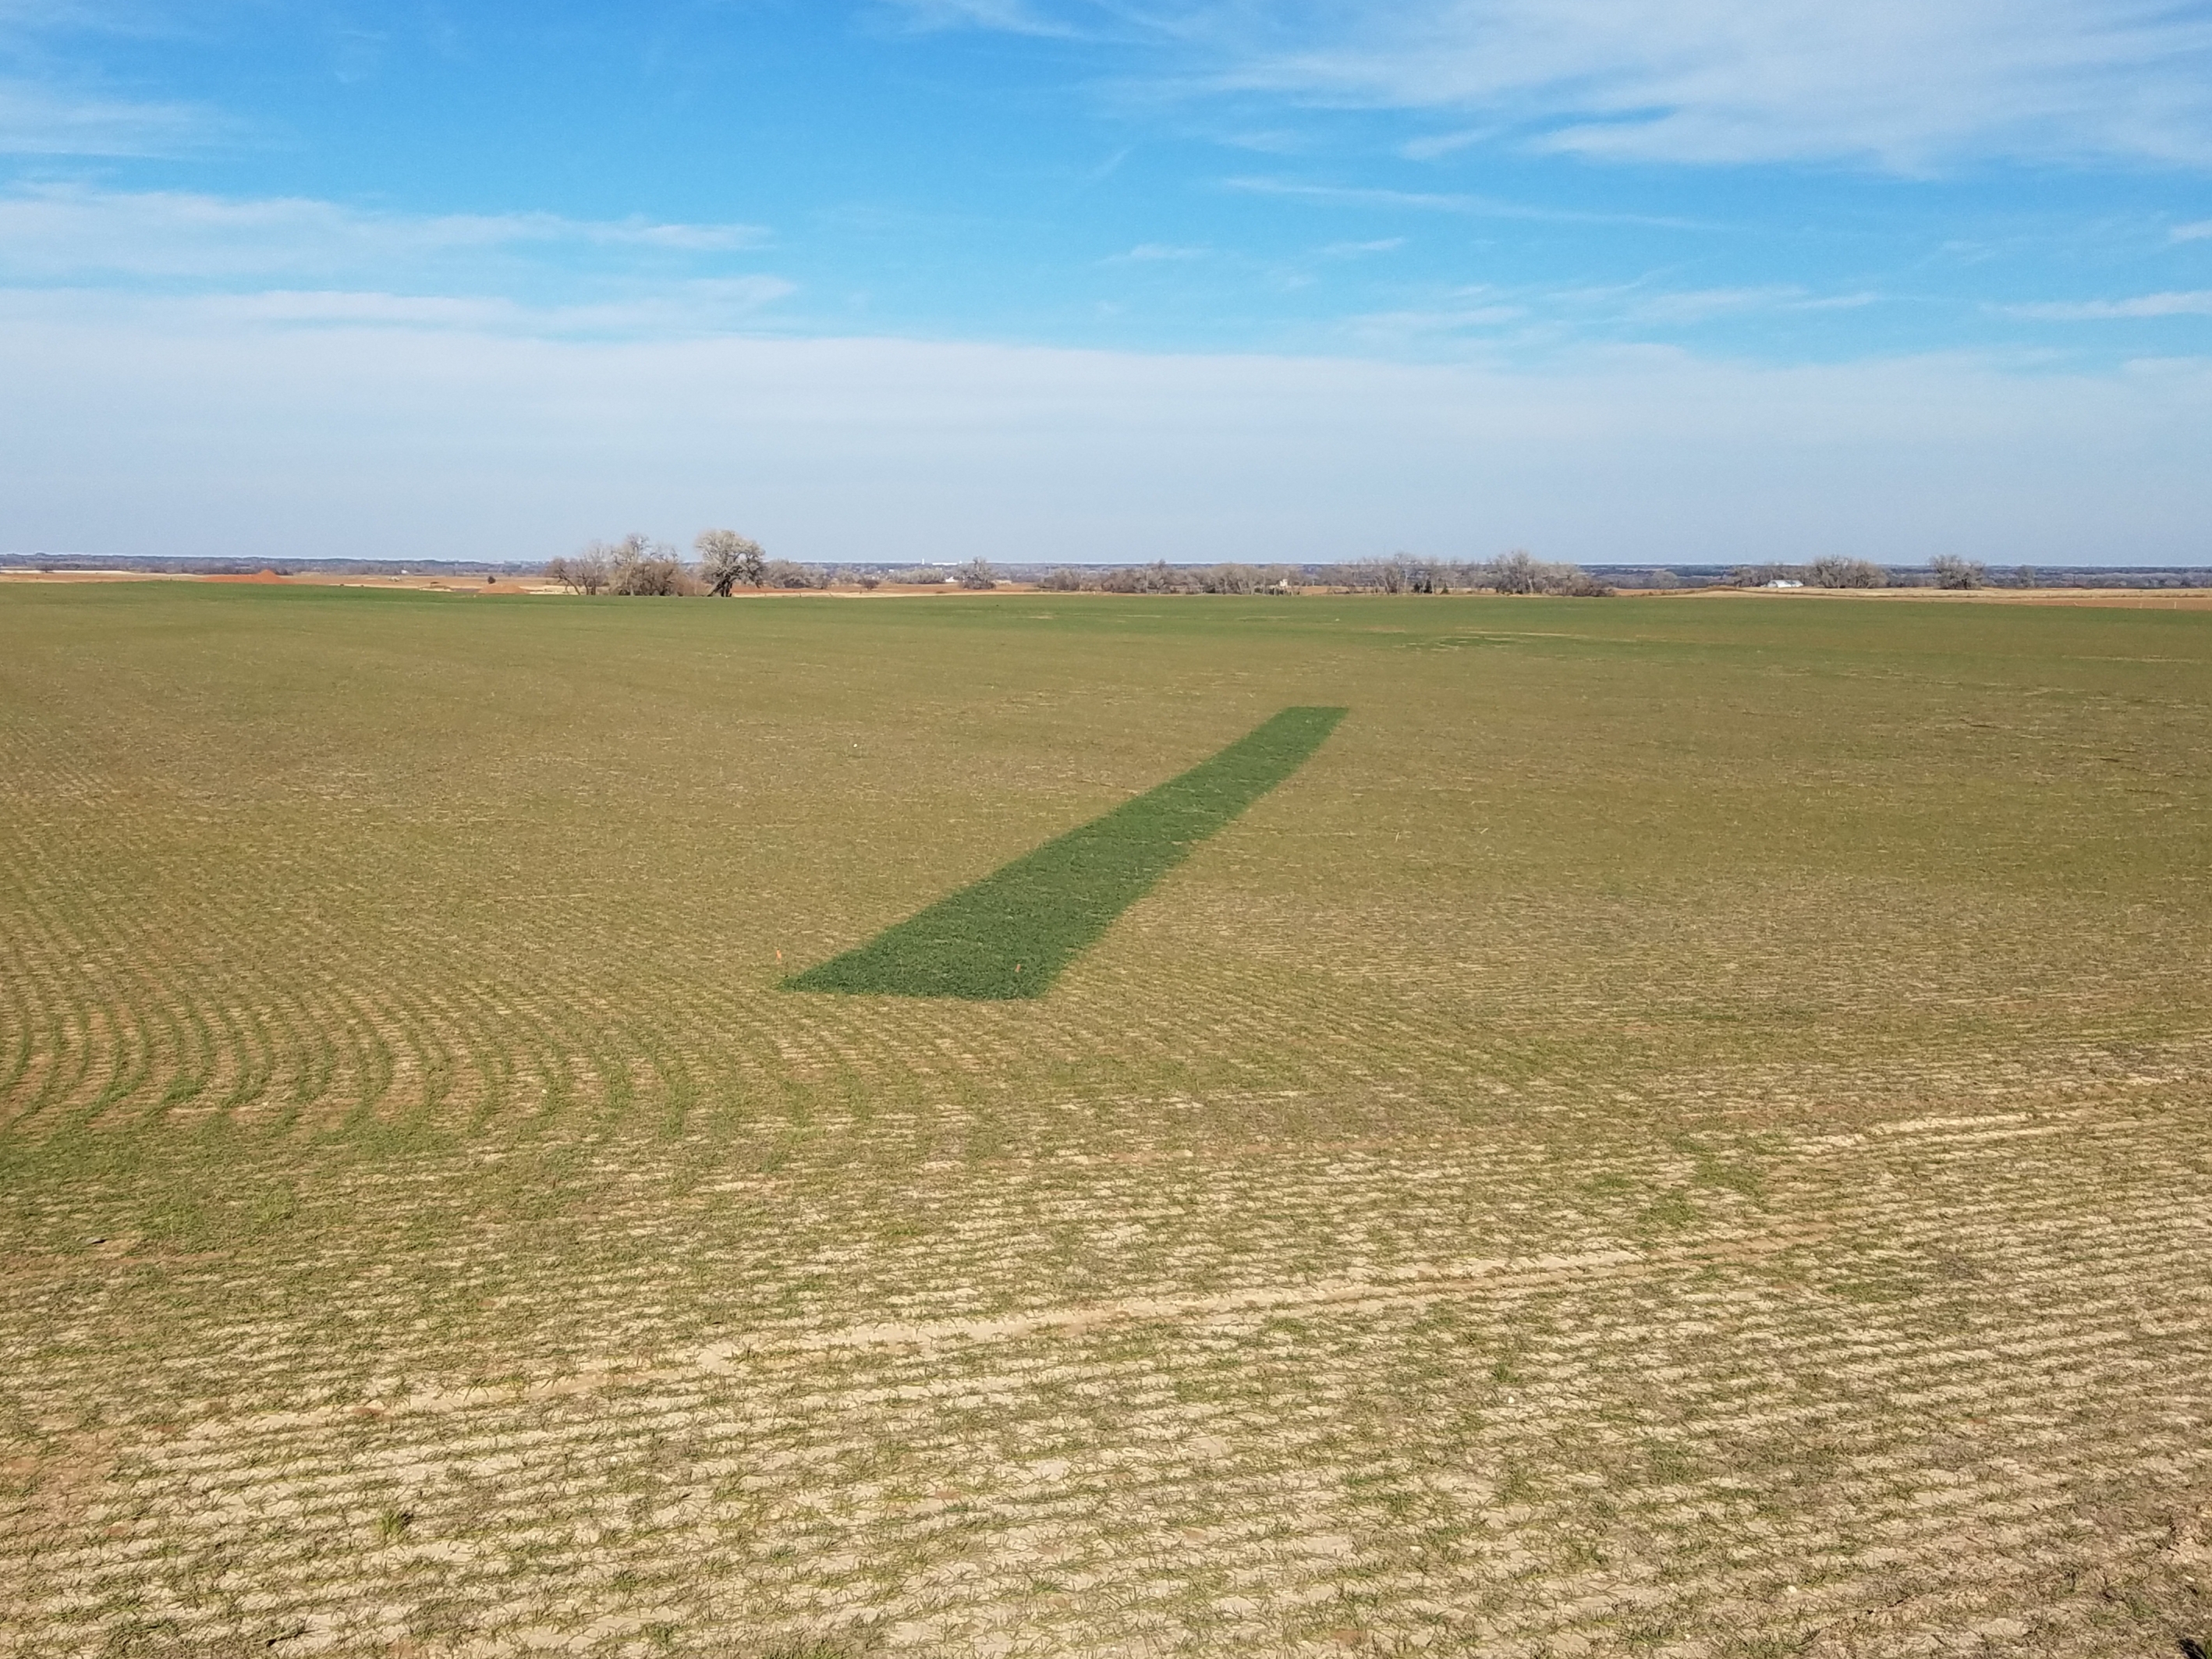
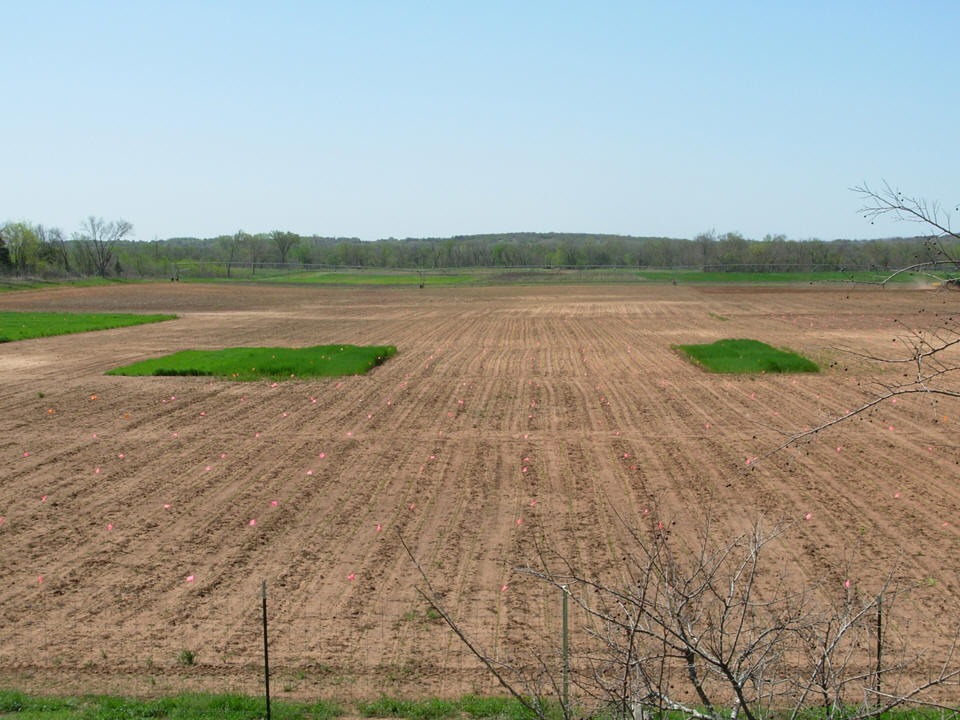
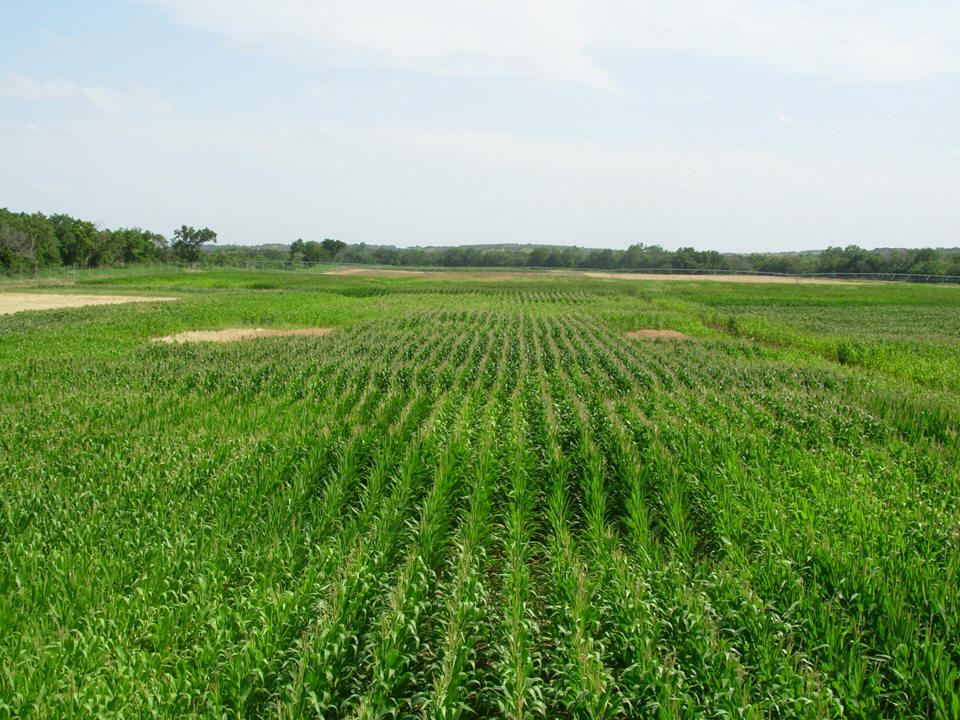
 N Rich Strip, EFAW
 |
|
Figure 1. Wheat grain yields in the check (0 kg N/ha) and the N rich (112 kg N/ha) plots, and the associated response index (grain yield N rich, divided by the grain yield in the check) from 1971 to 2007 in the Stillwater 222 long-term winter wheat experiment. |
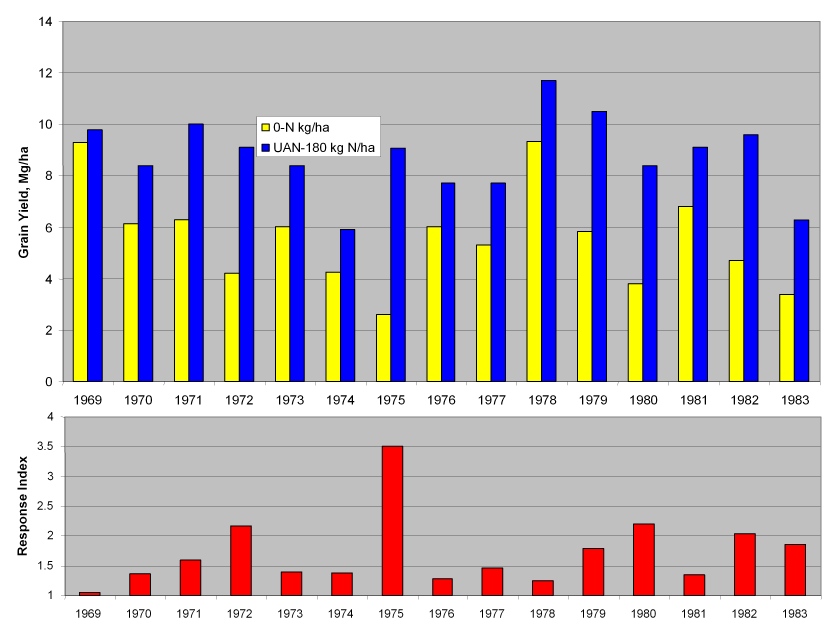
Figure 2. Corn grain yields in the check (0 kg N/ha) and the N adequate or N rich (180 kg N/ha) plots, and the associated response index (grain yield N rich, divided by the grain yield in the check) from 1969 to 1983 in the RC-RS long-term corn experiment conducted by Professor R.A. Olson near Mead, Nebraska.
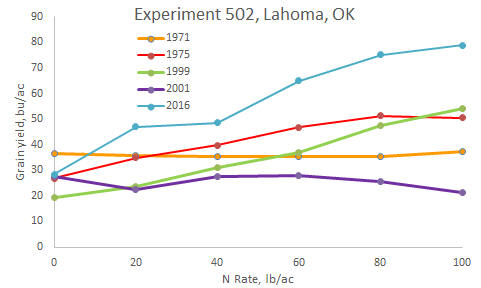
Figure 3. Wheat grain yields in the check (0 kg N/ha) and the N rich (112 kg N/ha) plots, and the associated response index (grain yield N rich, divided by the grain yield in the check) from 1971 to 2010 in the Lahoma 502 long-term winter wheat experiment.
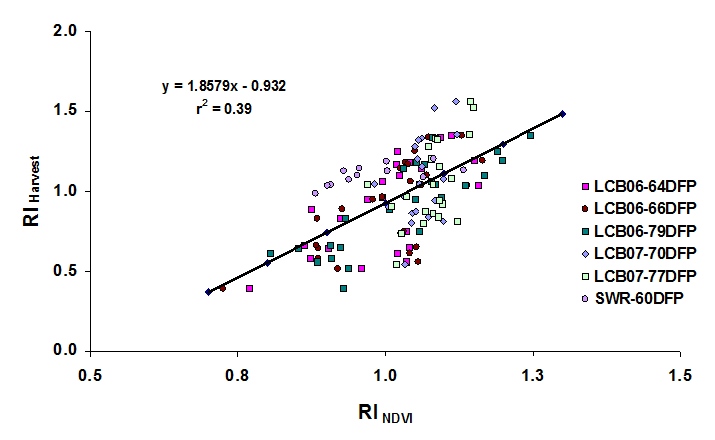
Relationship between RINDVI and RIHarvest at Feekes 5 across 62 locations in Oklahoma, 1998-2003.
Relationship between the estimated
responsiveness to applied N or response index (RI-NDVI) from sensor
readings (RI-NDVI = NDVI in the N Rich strip divided by the NDVI in the
farmer practice) and the response index determined at harvest (Grain
yield in the N rich strip plot divided by the N Rich strip in the farmer
practice), 2004 Corn Trials. Clearly, the responsiveness to N can
be determined from mid-season sensor measurements collected between V8
and V9.
2007: Relationship between the response index measured in season, (NDVI of fertilized plot / NDVI of check plot) from readings of cotton at growth stages from 60 to 80 days after planting, and measured lint yield and the response index measured at harvest (yield of fertilized plot / yield of check plot) from all site years.
Optical Sensor Based Algorithm
| RAMPED CALIBRATION STRIP |
|
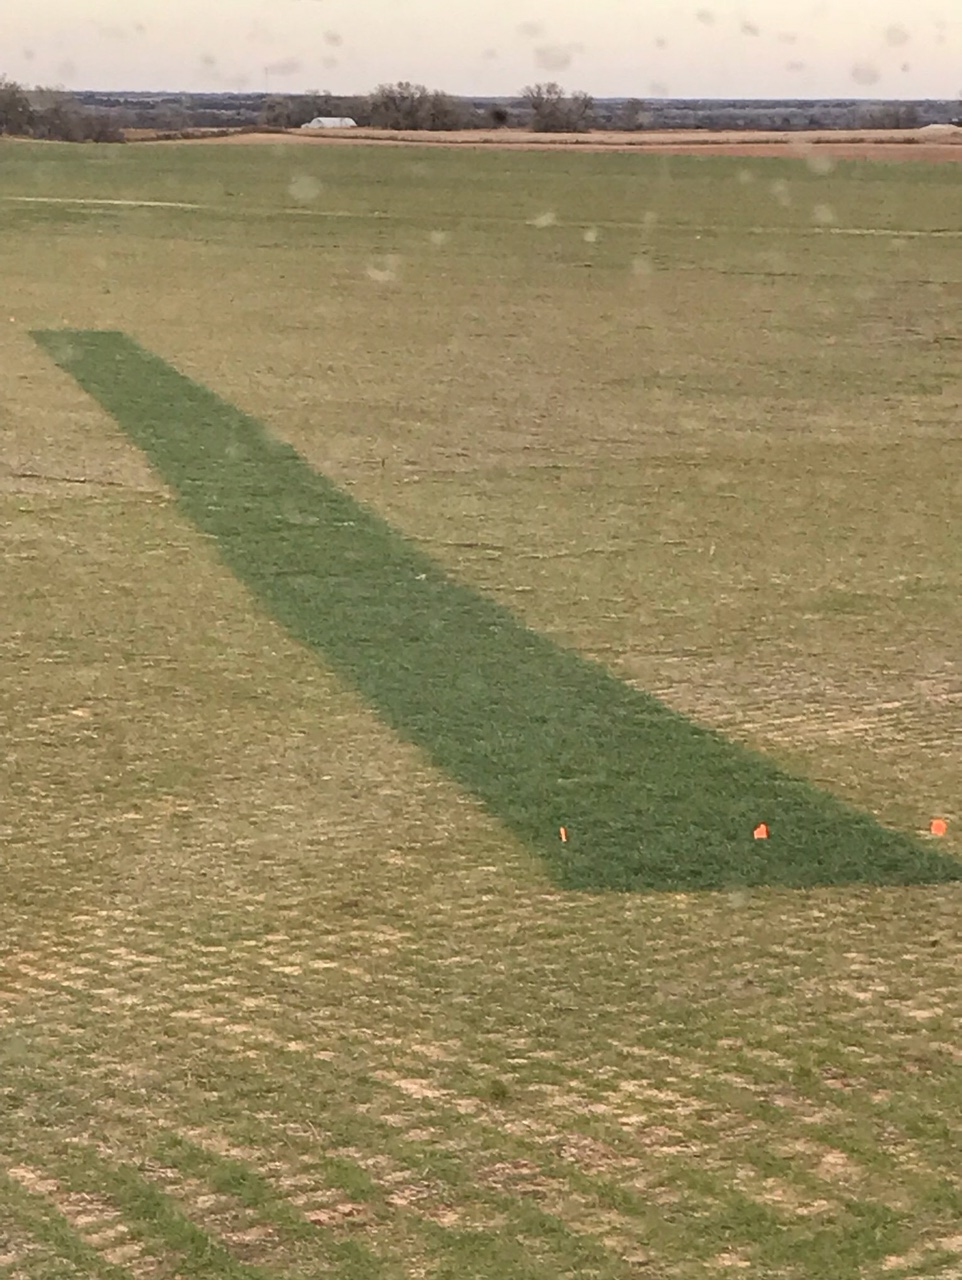
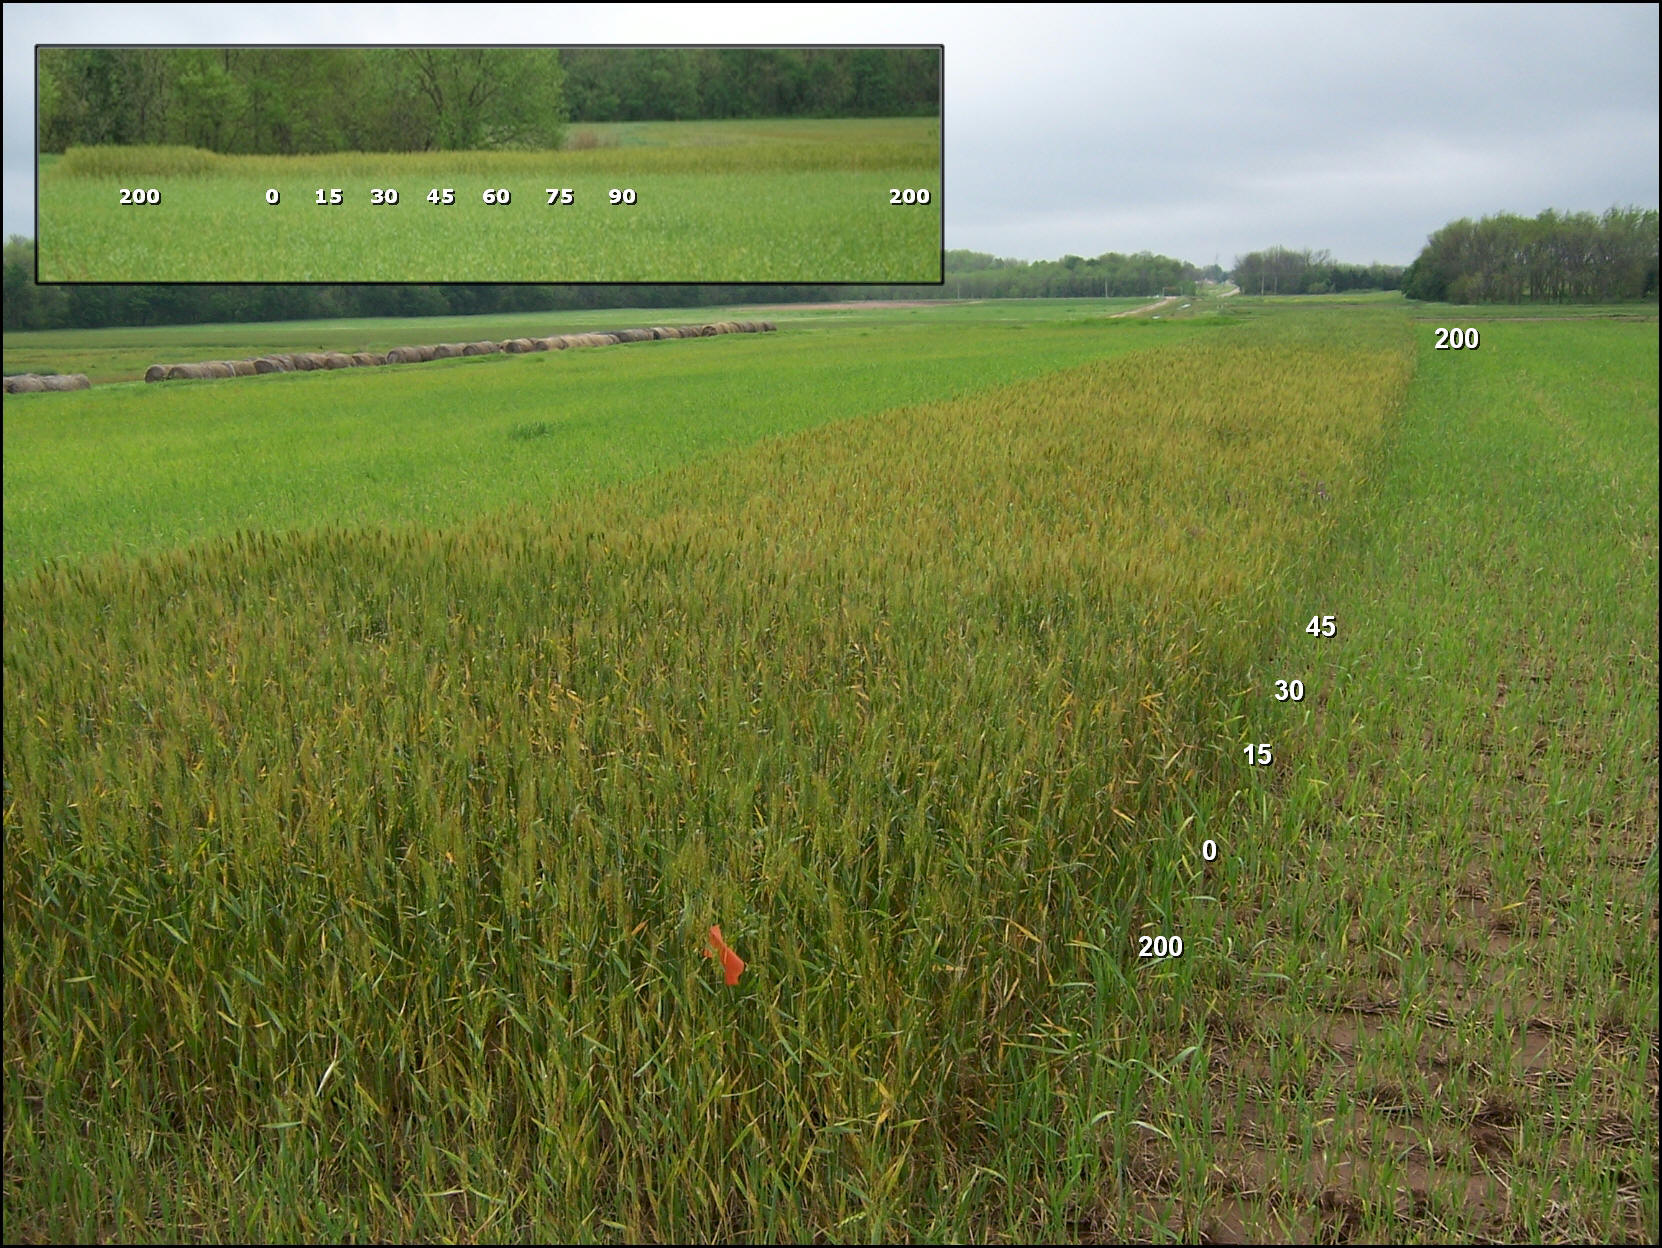
Summary:
The new Ramped Calibration Strip Applicator applies increasing levels of N in a strip across a fixed distance (160 to 320) feet. The levels applied range from 0 at the start of the strip to the maximum that could ever be expected to be used. This fertilizer is applied pre-plant or in a very early crop growth stage. An N-rate recommendation can be determined by visual inspection or with a hand-held sensor by walking the strip from the low rate toward the high rate and stopping at the point where there are no further changes in crop growth or NDVI. The N-rate applied at that spot (where no further changes in NDVI were noted) is the N-rate recommendation. |
|
Brent Rendel, Rendel Farms has Built a Producer Version of
the RAMP Applicator (low cost, manually controlled
version that virtually anyone could build) (Spring 2007) 6504 South 600 Road Miami, OK 74354 |
|
Curtis and Levi Johnson (Johnson Farms) J2 RAMP
Applicator (Spring 2007) R.Rt 1, Box 82 Helena, OK 73741 |
|
How to build your own RCS Applicator (OSU, 2006) Randy Taylor Department of Biosystems and Agricultural Engineering Oklahoma State University Stillwater, OK 74078 405 744 5277 randy.taylor@okstate.edu |
| RAMP Page (Brian Arnall) |
|
Jason Lawles (RAMP
Applicator) Spring 2007 Western Equipment 4501 E. Main, P.O. Box 391 Weatherford, OK 73096 580 772-5578 580-331-7107 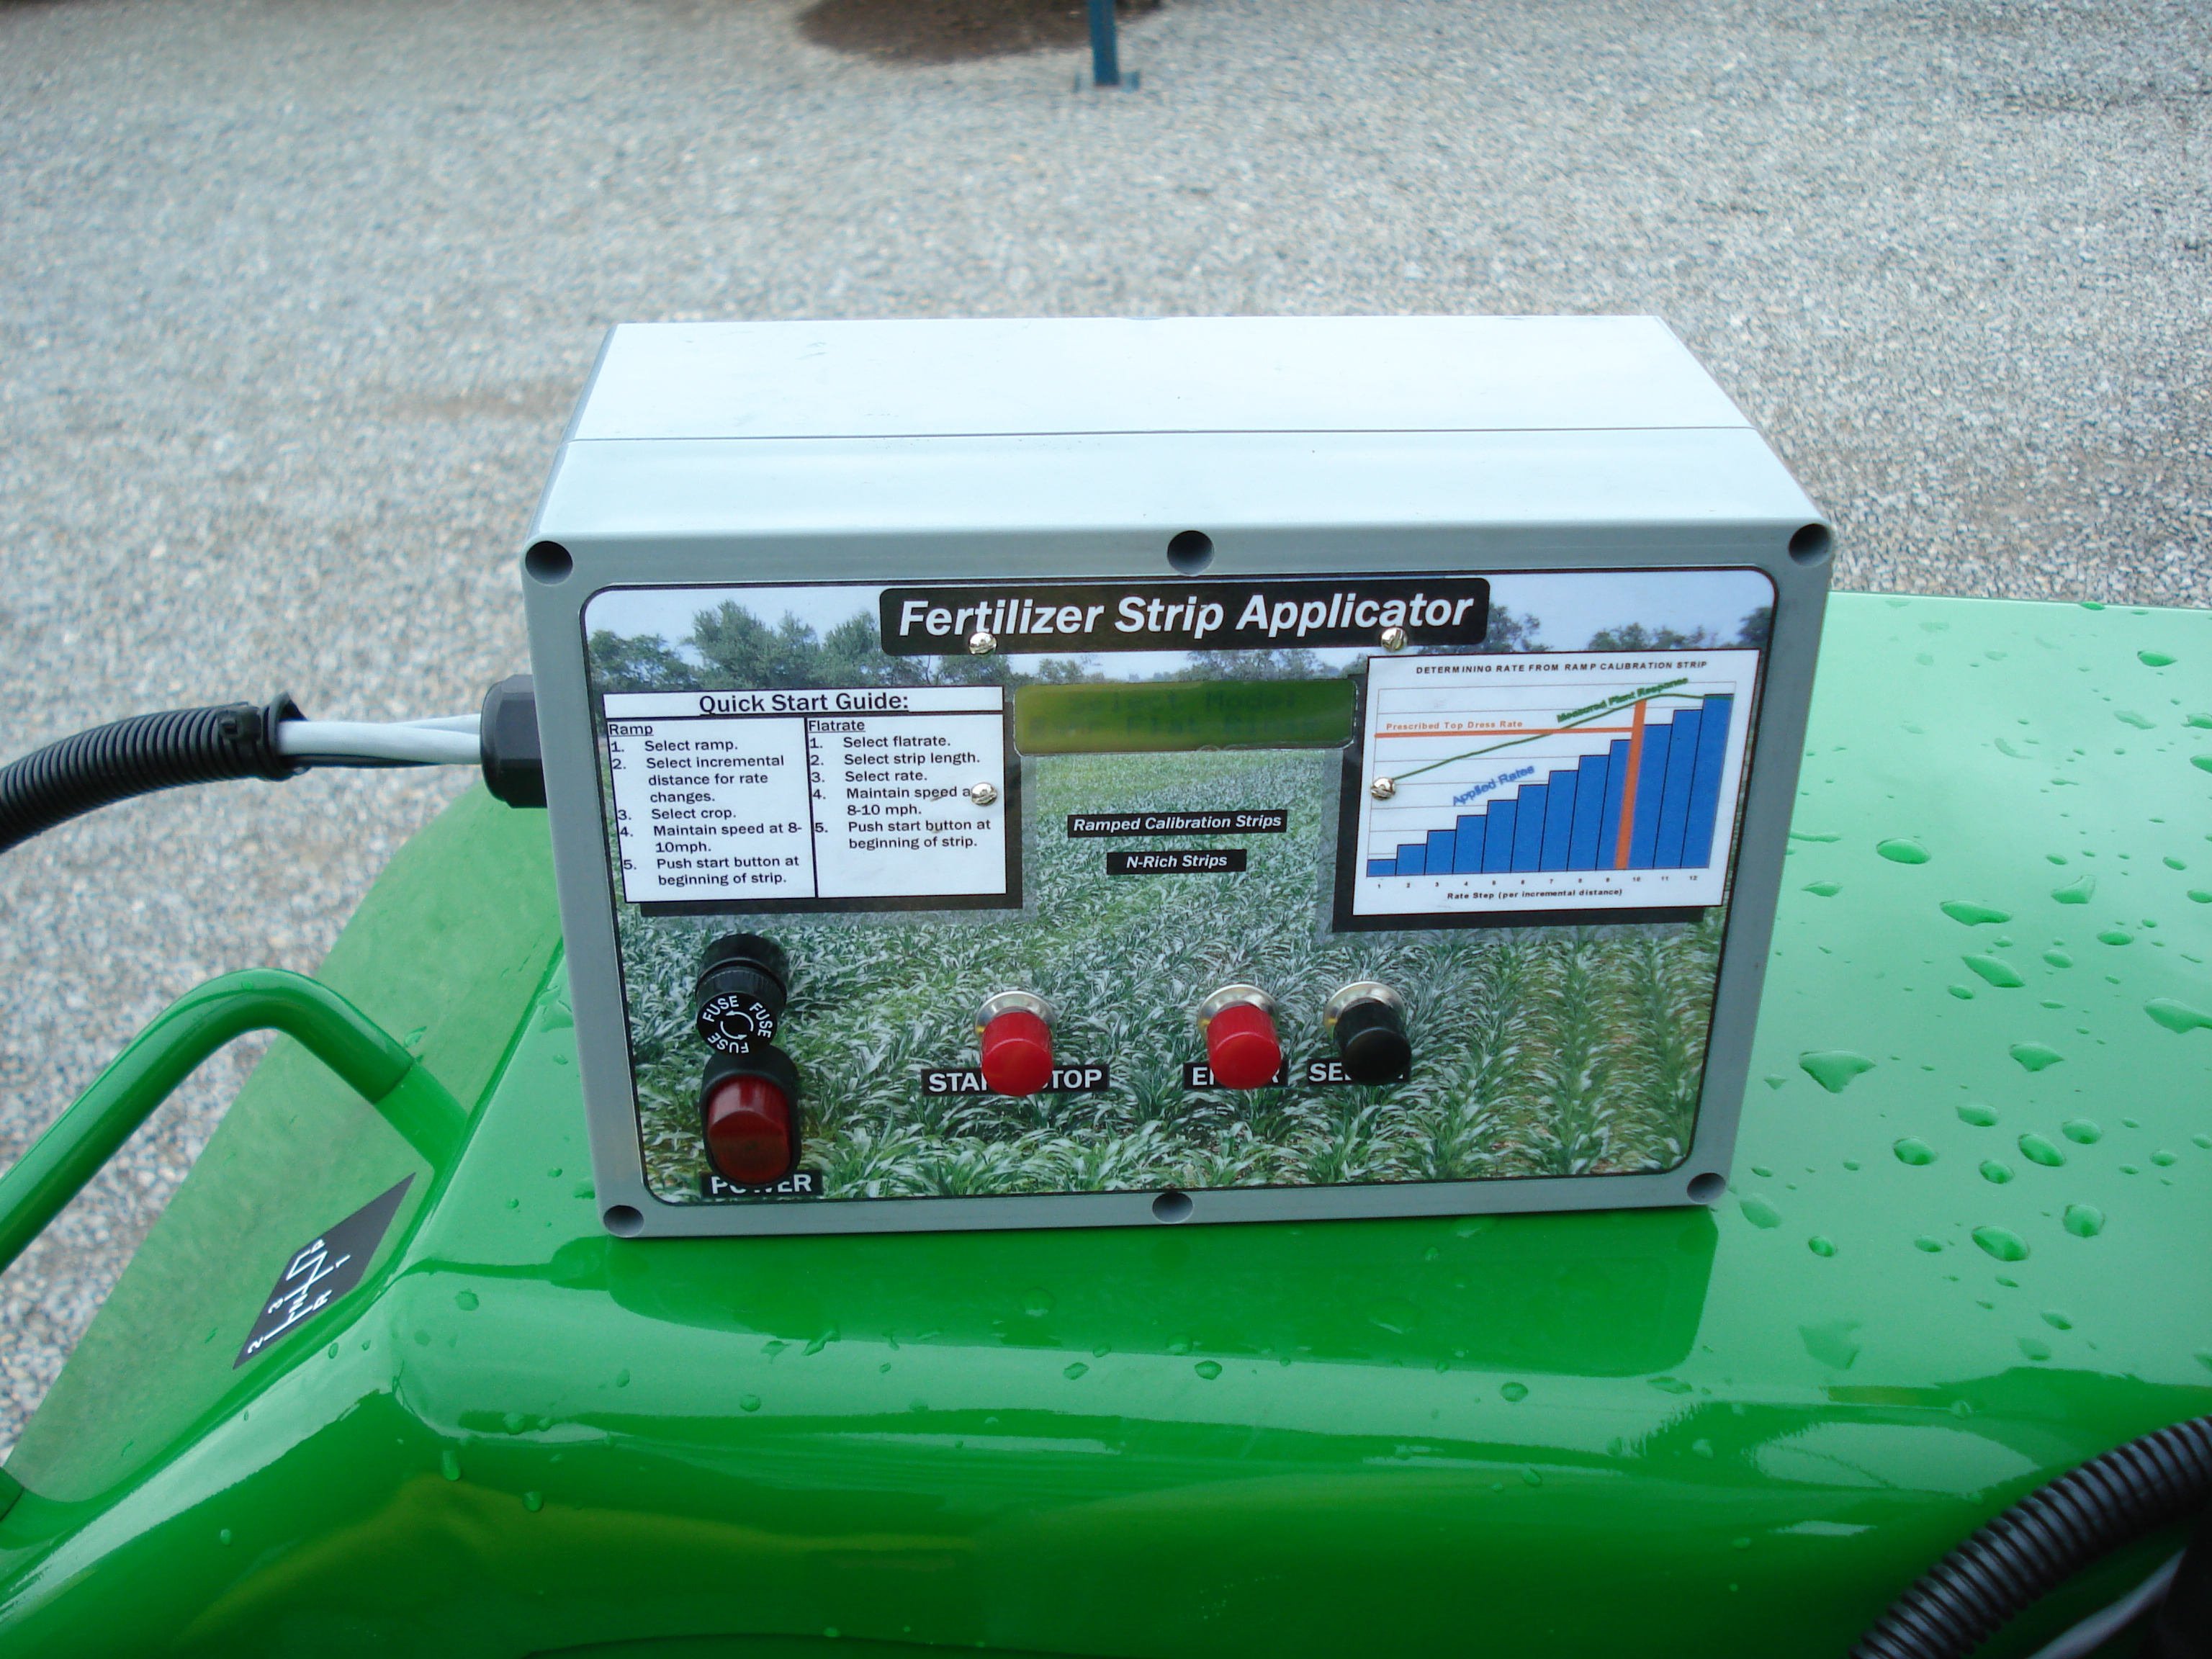
|
|
N Rich Strip Adopters Brent Rendel (see link below where he
has developed several rampers) Jimmy Wayne Kinder, near Walters Panhandle via extension presentations
Brian gave in Boise City and Woodward Jason Lawles via Western Equipment
(several hundred) Curtis Fischer (Kingfisher) Kim Metcalf (now with Estes Chemical) Gerald Wynes (Ponca City), many Jagadeesh Mosali (N rich strips in Bermuda, many locations) Roger Gribble (many) Ivan Peck (many on his own for the last 5 years) Monsanto (many via Kyle Freeman, Kyle Lawles, and Paul Hodgen) |
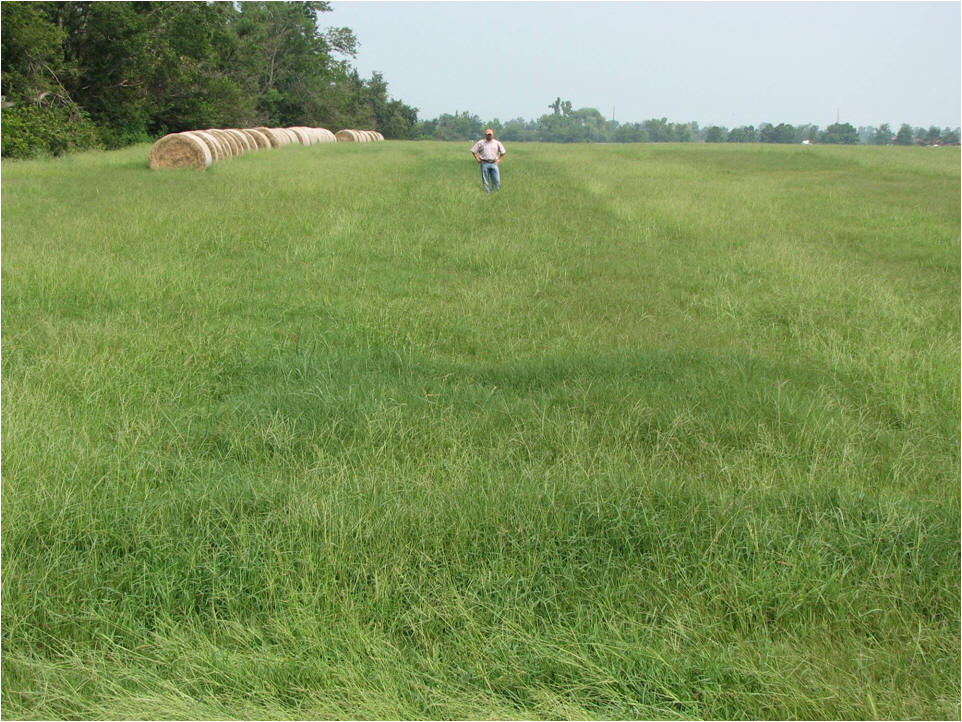 Delaware County, Bermudagrass, 2007 (RAMP peaked at 200 lb N/ac, with a range from 0 to 350 lb N/ac. |