
Micro-Variability in Soil Test, Plant Nutrient, and Yield Parameters in Bermudagrass, 1998 (Soil Sci. Soc. Am. J. 62:683-690)
W.R. Raun*, J.B. Solie, G.V. Johnson, M.L. Stone,
R.W. Whitney, H.L. Lees, H. Sembiring, and S.B. Phillips
Dep. of Plant and Soil Sciences and Dep. of Biosystems and Agricultural
Engineering, Oklahoma State University, Stillwater, OK 74078; Contribution
from the Okla. Agric. Exp. Stn. *Corresponding author.
Abstract
The scale or
resolution where distinct differences in soil test and yield parameters can be
detected has not been thoroughly evaluated in crop production systems. This
study was conducted to determine if large differences in soil test and forage
yield parameters were present within small areas (< 1 m2). A 2.13
x 21.33 m area was selected for intensive forage and soil sampling from two
bermudagrass pasture sites (Burneyville and Efaw). Each 2.13 x 21.33 m area
was partitioned into 490, 0.30 x 0.30 m (1’x1’) subplots. Bermudagrass forage
was hand harvested at ground level from each 0.30 x 0.30 m subplot. Prior to
forage harvest, spectral radiance readings (red, 671 +/- 6 nm; green, 550 +/- 6
nm; and near infrared, 780 +/- 6 nm) were recorded from each subplot. Composite
samples composed of eight soil cores, 0-15 cm deep, 1.9 cm in diameter were
collected from each subplot. At both locations bermudagrass forage yield
harvested from 0.30 x 0.30 m subplots ranged from less than 1300 kg ha-1
to greater than 10000 kg ha-1. Soil pH ranged from 4.37 to 6.29
within the 2.12 x 21.33 m area at Burneyville and 5.37 to 6.34 at Efaw. No P
or K fertilizer would have been recommended at Efaw using mean soil test P and
K. The range in recommended fertilizer rates would have been 0-31 and 0-17 kg
P ha-1 and 0-107 and 0-108 kg K ha-1 at Burneyville and
Efaw, respectively, if recommendations were based on individual 0.30 x 0.30 m
grid data. Significant differences in surface soil test analyses were found
when samples were less than 1 m apart for both mobile and immobile nutrients.
Precision farming has become an integral part of modern day
agriculture that has and will impact growers, fertilizer dealers, equipment
industries and environmental groups. Recent work in precision agriculture has
used yield maps as keys to identifying spatial variability in crop production
systems without questioning the resolution at which yield maps are generated.
Present day yield maps that use global positioning systems (GPS) have been
generated at a resolution of approximately 10x10m. Some differentially
corrected GPS systems work at a 1 m2 resolution or less. However,
GPS resolution has not been driven by what was agronomically needed but by
what was technologically possible.
Solie et al. (1996) noted that the fundamental field element is that area which provides the most precise measure of the available nutrient where the level of that nutrient changes with distance. They further indicated that variable rate technology which treats field elements greater than 1.96 m2 will likely not optimize fertilizer N inputs while having the potential for misapplying fertilizers as a result of using too coarse a grid.
The ideal field element size in precision agriculture production systems should theoretically be concerned with or able to identity:
1. the smallest resolution where cause and effect relationships can be identified
2. the precise resolution where variances between paired samples of the same size (area) become unrelated (use of semivariograms) and where heterogeneity can be recognized
3. the resolution where misapplication could pose a risk to the environment
4. the treated resolution where net economic return is achieved (inputs exclude the cost of technology)
5. the resolution where differences in yield potential may exist
Yost et al. (1982) collected surface (0-15 cm) soil samples from the Island of Hawaii at 1-2 km intervals along 21 transects. These data were then used to develop a soil P sorption map using an optimal geostatistical technique called kriging. Their work noted that the kriged points corresponded with known soil P behavior and that kriging provided estimates of the reliability of the resulting map. Cahn et al. (1994) studied much smaller scale spatial variation in soil test parameters. This work indicated that reducing sampling intervals from 50 to 1 m reduced the variance of measured soil water content, soil organic carbon, NO3-N, PO4-P and K by more than 25%. Paz et al. (1996) noted that error due to spatial dependence could be reduced by taking soil samples 20-25 m apart. Alternatively, Guertal (1994) found soil sampling on 5-m intervals to be too coarse to calculate fundamental field element size. In general, grid soil sampling has not been attempted for areas < 1 m2, possibly failing to identify micro-soil variability.
West et al. (1989) found wide variations over short distances (30 m) in soil organic C (16.2 to 34.8 g kg-1) and total N (1.94 to 4.64 g kg-1) in surface horizons (0-7.5 cm) in their studies with grazed pastures. Their work which focused on animal deposition concentrates near watering areas noted that differences in soil organic C in the sampled pastures tended to be more associated with native soil variations and unrelated with distance from the water source as was observed for extractable soil P and K. Recent work by Borges and Mallarino (1997) found that variability tended to be lower for soil test P when compared to other variables including dry weight, K and P uptake.
Peck and Soltanpour (1990) noted that present soil sampling procedures need to be reexamined. They also indicated that variability in the fertility patterns within a given field will continue to grow and that the problem of assessing the true or average fertility level for a given field will become more difficult. Reuss et al. (1977) suggested that the large number of cores required to obtain a narrow confidence limit may be more important than the percentage of the area that is improperly fertilized due to spatial variability.
Our objective was to determine if variability in soil test and forage yield parameters was present for areas < 1 m2 in two bermudagrass pastures.
Materials and Methods
Two established bermudagrass pastures were used for this study. The experimental sites were near Stillwater (Efaw Experiment Station), and Burneyville, OK. The soil at Stillwater was a Norge loam (fine-silty, mixed, thermic Udic Paleustoll) and at Burneyville, a Minco fine sandy loam (coarse-silty, mixed, thermic Udic Haplustoll). Established stands of 'Greenfield' and 'Midland' bermudagrass varieties were used at Efaw and Burneyville, respectively where no fertilizers had been applied for the past five years. At each location, a visually homogenous 2.13 x 21.33 (7’ x 70’) area was selected for intensive forage and soil sampling. Each 2.13 x 21.33 m area was partitioned into 490 subplots that were 0.30 x 0.30 m (1’x1’). Bermudagrass was harvested on July 17, 1996 at Efaw and August 8, 1996, at Burneyville. At both sites, bermudagrass harvest took place at booting stages 21-29 as morphologically defined by West (1990). Bermudagrass forage was hand harvested at ground level from each 0.30 x 0.30m subplot, and wet weights were recorded prior to drying at 70 C in a forced air oven. Bermudagrass forage samples were ground to pass a 120 mesh sieve (< 0.125 mm) and analyzed for total N using a Carlo-Erba (Milan, Italy) NA-1500 dry combustion analyzer (Schepers et al., 1989). Total N uptake from forage samples was determined by multiplying dry matter yield by the total N concentration determined from dry combustion.
Following the collection of bermudagrass forage, soil samples (0-15 cm deep) were taken from each 0.30 x 0.30 m subplot (8 cores/subplot). Soil samples were air dried at ambient temperature and ground to pass a 200-mesh sieve (< 0.075 mm) and analyzed for total N and organic C (Schepers et al., 1989). Duplicate soil samples were also extracted using 2M KCl (Bremner, 1965) and analyzed for NH4-N and NO3-N using an automated flow injection analysis system. Soil pH was determined using a glass electrode and a soil/water ratio of 1:1. Extractable P and K were determined using the Mehlich III procedure (Mehlich, 1984). Nitrogen fertilizer rates were determined by subtracting the combined surface NH4-N + NO3-N in mg kg-1 from the N requirement determined using a 6720 kg ha-1 yield goal (3 tons/acre). This translates into 58 kg N ha-1 Mg-1 (50 lb N acre-1 ton-1). Phosphorus and potassium fertilizer rates were determined as;
kg P ha-1 = -1.117*(Mehlich III P in mg kg-1) + 34.12
kg K ha-1 = -0.981 (Mehlich III K in mg kg-1) + 119.46
The fertilizer recommendation equations reported above were derived from soil test calibration tables reported by Johnson et al. (1997).
Prior to forage harvest, spectral radiance readings were obtained from each 0.30 x 0.30 m subplot using an integrated sensor and signal processing system. The integrated sensor had already been modified for use on a variable N rate applicator (Stone et al., 1996). Photodiode detectors and interference filters for red (671 +/- 6 nm), green (550 +/- 6 nm) and NIR (780 +/- 6 nm) spectral bands with a 0.30 m wide by 0.08 m spatial resolution, were used. An uncalibrated normalized-difference-vegetation-index (NDVI) was used as reported by Perry and Lautenschlager (1984), Duncan et al. (1993) and Stone et al. (1996), where NDVI = (NIR-red)/(NIR+red). A total of seven sensor readings were recorded from each 0.30 x 0.30 m subplot and average values for red, green, NIR and NDVI were determined.
Geostatistical treatment of the data is reported and discussed in a separate manuscript.
Results
Precision of Soil Test Procedures
For each chemical procedure, one soil sample was randomly chosen from the population of 490 samples at Efaw and analyzed ten different times to assess procedural precision (Table 1). Documentation of procedural precision (analytical error) was considered important prior to making any inferences concerning spatial variability. Coefficients of variation for all chemical procedures were less than 6%, demonstrating the high procedural and analytical precision of the procedures employed (Table 1). These results, by procedure, were all within published limits for relative percent error (Horwitz, 1982, Greenberg et al., 1992).
Soil Sampling Error
Once procedural precision was established it was then necessary to document sampling error prior to observing differences across the entire area. To do this, 20 of the 490, 0.30 x 0.30 m subplots were selected at random from the 2.13 x 21.33 m area that had already been sampled (A) and they were soil sampled again using the same procedures, eight cores/subplot, 0-15 cm (B), discussed in materials and methods. These samples were used to assess the error in soil sampling 0.30 x 0.30 subplots. Variances about the means for A and B soil sample groups when analyzed for pH, organic C, P and K were found to be equal. Although taking eight cores in 0.30 x 0.30 m plots was expected to be destructive, means for soil pH, organic C, P and K from the first (A) and second sample (B) taken from the same area were also not different using a paired T-test on the computed differences (A-B) as reported in Table 2 (Prob |T|, SAS, 1988). The sampling error was small when analyzing the reproducibility (A versus B, Table 2). As per Steel and Torrie (1980), coefficients of variation (CV) were determined that provided a relative measure of variation from individual samples taken from the same 0.30 x 0.30 m area. CV's did not exceed 3.6% for soil pH, and averaged 0.8%. Similarly, CV's were small for soil organic C and K averaging less than 5.7%. Unlike observations for pH, organic C, and K, soil P was found to vary considerably (Table 2). Even though eight cores per 0.30 x 0.30 m was expected to provide an accurate estimate of soil test P in this small of an area, there was apparently more variability within plots than previously thought. Work by Follett and Peterson (1988) demonstrated significant differences in soil test P when sampled at depths of 0-5, 5-10 and 10-20 cm. Although sampling here was targeted for 0-15 cm, some error may have been encountered by depth since several different people were needed to collect the 490 forage and 490 soil samples at each site.
Linear Transect Variability
One transect (70 consecutively sampled 0.30 x 0.30 m subplots, 21.33 m in length) was randomly selected at each site to demonstrate the linear variability in selected soil test parameters and resultant N and P recommendations (Figures 1 and 2). Soil samples from each of these transects (70 samples/transect) were analyzed for organic C, total N, Mehlich III P and K, NO3-N and NH4-N and then the same analysis repeated one week later. Although not reported in this section, soil pH and K provided similar results. The mean was calculated and error bars were plotted that represented one standard deviation from this duplicate analyses (Figures 1 and 2). By-plot error bars that are not visible were small and underlie the individual symbol on each graph.
The combined processing and analytical precision was excellent since few error bars overlapped when organic C in neighboring samples differed by at least two g kg-1 (Figures 1 and 2 ). Similar to observations for organic C, duplicate Mehlich III P-analyses varied considerably over the Efaw and Burneyville transect data (Figures 1 and 2). At both sites, concentration differences in excess of 20 mg kg-1 were observed over distances less than 1.5 m. At Burneyville, no P fertilizer would have been recommended 1 m away from a cluster of samples which would have required 25 kg P ha-1. Similar differences were noted at Efaw over very short distances, although mean soil test P levels were much higher.
Reproducibility of NH4-N+NO3-N soil test data was good as indicated by the minimal amount of variability in all error bars from duplicate analyses over transect data at Burneyville and Efaw. Fertilizer N rates would have been reduced by as little as 10 kg N ha-1 to as much as 50 kg N ha-1 over very short distances (for every 1 mg kg-1 NO3-N or NH4-N, fertilizer N can be reduced 2.24 kg ha-1). However, it should be noted that the variability in NH4-N+NO3-N was small compared to P, a result of moderate yields and no N fertilizer input over the past five years which depleted much of the mineral N in the surface horizon.
Variability in Soil Test Analyses and Spectral Radiance
Soil pH within the 2.13 x 21.33 m area sampled ranged from 4.37 to 6.29 at Burneyville and 5.37 to 6.34 at Efaw (Table 3). It was somewhat surprising to find these large differences in soil pH (Burneyville 1.92, Efaw 0.97) within the 45 m2 areas sampled. Although the mean soil pH was near 5.50 at both sites, several values were below 4.5 at Burneyville. At pH below 4.5, Al and/or Mn in soil solution can increase to toxic levels, thus lime would be required in these areas to alleviate the toxicity.
Low soil test NH4-N + NO3-N values were expected since no fertilizers have been applied at either site for the past five years. However, with a relatively low yield goal of 6720 kg ha-1 (3 tons/acre), N fertilizer rates would have ranged from 109 to 166 and 124 to 156 kg N ha-1 at Burneyville and Efaw, respectively after subtracting soil NH4-N +NO3-N from the 168 kg N ha-1 base recommendation.
Mean soil test P and K values were more than 80% sufficient for bermudagrass production (18.4 mg P kg-1 and 130 mg K kg-1) as reported by Johnson et al. (1997). Projected response from an application of P and K would be small at these soil test levels (Johnson et al., 1997). At Burneyville, mean P and K soil test levels would have resulted in recommending 11 kg P ha-1 and no fertilizer K for bermudagrass production. No P or K fertilizer would have been recommended at Efaw using mean soil test P and K. However, recommended fertilizer rates of 32 and 15 kg P ha-1 and 133 and 136 kg K ha-1 at Burneyville and Efaw, respectively, would have resulted when calculated based on minimum values from 0.30 x 0.30 m grid data (Table 3).
Total soil N and organic C were also variable at each site, however, a much wider range was found at Burneyville (Table 3). This was also found in calculated C:N ratios. Spectral radiance measurements for NIR, Red, Green and calculated NDVI paralleled soil test findings, with recorded ranges wider at Burneyville than Efaw (Table 3). Similar to spectral radiance data, the range in forage moisture was much wider at Burneyville compared to Efaw. Because a wide range in forage moisture was found, variability in NIR was also expected since NIR diffuse reflectance spectrophotometry has been used to predict moisture content in forages (Windham et al., 1987). Similar studies have found good correlation between NIR and soil moisture (Dalal and Henry, 1986).
Variability in Bermudagrass Forage Yield
At both locations bermudagrass forage yield harvested from 0.30 x 0.30m subplots ranged from less than 1300 kg ha-1 to greater than 10000 kg ha-1 (Table 3). Finding a 44 and 19 fold difference in yield at Burneyville and Efaw, respectively, within a 45 m2 area was notable considering that the precision error in estimating yield (precision of scale for wet and dry weights, and harvest area error) was estimated at +/- 480 kg ha-1. Similarly, 76 and 15 fold differences in bermudagrass forage N uptake were observed where precision error was +/- 10 kg N ha-1 (Table 3, Burneyville and Efaw, respectively).
Correlation of Yield, Soil Test and Spectral Radiance Measurements
Correlation of bermudagrass yield and N uptake, soil test and spectral properties was performed. NDVI was highly correlated with bermudagrass forage yield and N uptake at Burneyville while providing inconsistent results at Efaw. At Efaw, an older bermudagrass stand contributed to significant amounts of dead biomass (non-green) at harvest and this likely influenced red spectral radiance readings which would be more indicative of the presence and/or absence of green and intensity of green. This was confirmed in the narrow range of red spectral radiance readings recorded for Efaw when compared to Burneyville (Table 3).
Using the entire population of data, soil test results were not correlated with bermudagrass yield or N uptake at either location. This is because N was limiting yield at both sites since no N fertilizer had been applied for over five years. Soil test NH4-N+NO3-N determined following harvest was not expected to be correlated with yield either, since soil test levels were low at both sites. The relationship between soil test P or K and dry matter yield would not be identifiable when N or another variable was limiting. It is only when all other variables are non-limiting that a significant relationship between a specific soil test procedure and yield can be established.
Discussion
The 2.13 x 21.33 m areas that were sampled on a 0.30 x 0.30 m grid in this work were used to document the resolution where real differences in both soil test and yield parameters could be detected. These areas were not intended to be ‘representative’ of the entire range in variability found in each field, but rather representative of the fixed area or resolution where variability could be expected. Chancelor and Gornonea (1994) indicated there is evidence of considerable potential for using submeter sampling and response intervals. Similarly, Solie et al. (1996) noted that "variable rate technology which treats field elements greater than 1.96m2 will likely not optimize fertilizer N inputs while having the potential for misapplying fertilizers as a result of too coarse a grid." In this regard, this work reports significant differences in soil test analyses at resolutions less than 1 m2 reported by others for both mobile and immobile nutrients (NO3-N and P). This kind of micro-variability in all soil test parameters measured indicates that grid soil sampling would be necessary but unlikely to be economical (with a field element size of 1m2 this would require 10000 soil samples/hectare). Considering the large differences in soil test data, it was also not surprising to find large differences in forage yield.
Some consideration should be given as to why we found such large variability in such a small area. The random influence of cattle dung patches and the lasting effects of white clover (Trifolium repens L.) within dung patch areas has been documented by Weeda (1967). Castle and MacDaid (1972) reported that the average area of rejected herbage around cattle dung patches was 0.078 m2, one year after being deposited. Because of this, soil heterogeneity would only be detected if the sampling resolution were small enough to detect the micro-area of influence. This should also be the resolution where potential differences in soil test parameters are found.
It could be argued that significant differences in soil test parameters could be detected at the centimeter level (horizontally) as has been demonstrated vertically by Follett and Peterson (1988). Although this has not been researched, we believe that horizontal differences, by cm, may well exist in soils. However, from a crop production point of view, the rooting volume that is explored by individual plants, and that will vary by crop, will ultimately dictate the applicator resolution since the plant can integrate that variability into one unit or one mean value. In this regard, it is unlikely that horizontal plant root influence will be less than 0.30 x 0.30 m.
The random influence of wind deposits, alluvial wash, animal deposition, and animal death and decay, would be expected to increase soil variability. Outlying soil test observations, especially in non-cultivated pastures where mixing has not taken place, may be explained in part by sampling areas where animals died and decayed or where animal deposits influenced the plant species which grew in the area.
In theory, environmental stewardship should employ management practices that conform to the resolution where detectable differences in soil test parameters are observed in the field. The presence of significant differences in surface soil test analyses in this work, when samples were less than 1 m apart for both mobile and immobile nutrients, supports the existence of submeter variability.
Acknowledgements:
This work was supported in part by the Potash and Phosphate Institute, and their assistance was greatly appreciated.
References
Borges, R., and A.P. Mallarino. 1997. Field-scale variability of phosphorus and potassium uptake by no-till corn and soybean. Soil Sci. Soc. Am. J. 61:846-853.
Bremner, J.M. 1965. Inorganic forms of nitrogen. In C.A. Black et al. (ed.) Methods of soil analysis, Part 2. Agronomy 9:1179-1237. Am. Soc. of Agron., Madison WI.
Cahn, M.D., J.W. Hummel and B.H. Brouer. 1994. Spatial analysis of soil fertility for site-specific crop management. Soil Sci. Soc. Am. J. 58:1240-1248.
Carlo Erba Instruments. 1990. Nitrogen analyzer 1500 series 2 instruction manual. Milan, Italy.
Castle, M.E., and Elizabeth MacDaid. 1972. The decomposition of cattle dung and its effect on pasture. J. Br. Grassld Soc. 27:133-137.
Chancellor, W.J., and M.A. Goronea. 1994. Effects of spatial variability of nitrogen, moisture, and weeds on the advantages of site-specific applications for wheat. Trans. ASAE. 37:717-724.
Dalal, R.C., and R.J. Henry. 1986. Simultaneous determination of moisture, organic carbon and total nitrogen by near infrared reflectance spectrophotometry. Soil Sci. Soc. Am. J. 50:120-123.
Duncan, J., D. Stow, J. Franklin, and A. Hope. 1993. Assessing the relationship between spectral vegetation indices and shrub cover in the Jornada Basin, New Mexico. Int. J. Remote Sensing. 14:3395-3416.
Follett, R.F., and G.A. Peterson. 1988. Surface soil nutrient distribution as affected by wheat-fallow tillage system. Soil Sci. Soc. Am. J. 52:141-147.
Greenberg, Arnold E., Lenore S. Clesceri, and Andrew D. Eaton. 1992. Standard methods for the examination of water and wastewater. Am. Public Health Assoc. Washington DC.
Guertal, E.A. 1994. Geostatistical analysis of forms of soil nitrogen in a continuously cropped wheat field. Unpublished Ph.D. dissertation. Oklahoma State University, Stillwater, OK.
Horwitz, W. 1982. Evaluation of analytical methods used for regulation of foods and drugs. Anal. Chem. 54:67A-76A.
Johnson, G.V., W.R. Raun, H. Zhang, and J.A. Hattey. 1997. Oklahoma soil fertility handbook. Okla. Agric. Exp. Sta. Stillwater, OK.
Mehlich, A. 1984. Mehlich No. 3 extractant: A modification of Mehlich No. 2 extractant. Commun. Soil Sci. and Plant Anal. 15:1409-1416.
Paz, A., M.T. Taboada, and M.J. Gomez. 1996. Spatial variability in topsoil micronutrient contents in a one-hectare cropland plot. Commun. Soil Sci. Plant Anal. 27:479-503.
Peck, T.R., and P.N. Soltanpour. 1990. The principles of soil testing. p. 1-9. In R.L. Westerman (ed.) Soil testing and plant analysis. 3rd ed. SSSA Book Ser. 3. SSSA, Madison, WI.
Perry, Charles R., Jr., and Lyle F. Lautenschlager. 1984. Functional equivalence of spectral vegetation indices. Remote Sensing of Environ. 14:169-182.
Reuss, J.O., P.N. Soltanpour, and A.E. Ludwick. 1977. Sampling distribution of nitrates in irrigated fields. Agron. J. 69:588-592.
SAS. 1988. SAS/STAT User's Guide, Release 6.03 Edition. SAS Institute Inc. Cary, NC.
Schepers, J.S., D.D. Francis, and M.T. Thompson, 1989. Simultaneous determination of total C, total N, and 15N on soil and plant material. Commun. Soil Sci. Plant Anal. 20:949-959.
Solie, J.B., W.R. Raun, R.W. Whitney, M.L. Stone, and J.D. Ringer. 1996. Optical sensor based field element size and sensing strategy for nitrogen application. Trans. ASAE 39:1983-1992.
Steel, Robert G., and James H. Torrie. 1980. Principles and procedures of statistics, a biometrical approach. 2nd ed. McGraw-Hill Book Co., New York, NY.
Stone, M.L., J.B Solie, W.R. Raun, R.W. Whitney, S.L. Taylor, and J.D. Ringer. 1996. Use of spectral radiance for correcting in-season fertilizer nitrogen deficiencies in winter wheat. Trans. ASAE 39:1623-1631.
Weeda, W.C. 1967. The effect of cattle dung patches on pasture growth, botanical composition, and pasture utilisation. N.Z. J. Agric. Res. 10:150-159.
West, C.P., A.P. Mallarino, W.F. Wedin and D.B. Marx. 1989. Spatial variability of soil chemical properties in grazed pastures. Soil Sci. Soc. Am. J. 53:784-789.
West, C.P. 1990. A proposed growth stage system for bermudagrass. P. 38-42. In Proc. Am. Forage and Grassl. Conf. Blacksburg, VA. 6-9 June, 1990. Am. Forage and Grassl. Council, Georgetown, TX.
Windham, W.R., J.A. Robertson, and R.G. Leffler. 1987. A comparison of methods for moisture determination of forages for near infrared reflectance spectroscopy calibration and validation. Crop Sci. 27:777-783.
Yost, R.S., G. Uehara, and
R.L. Fox. 1982. Geostatistical analysis of soil chemical properties of large
land areas. II. Kriging. Soil Sci. Soc. Am. J. 46:1033-1037.
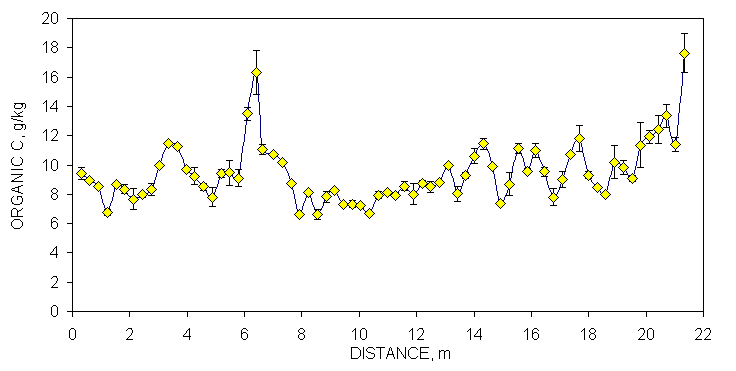
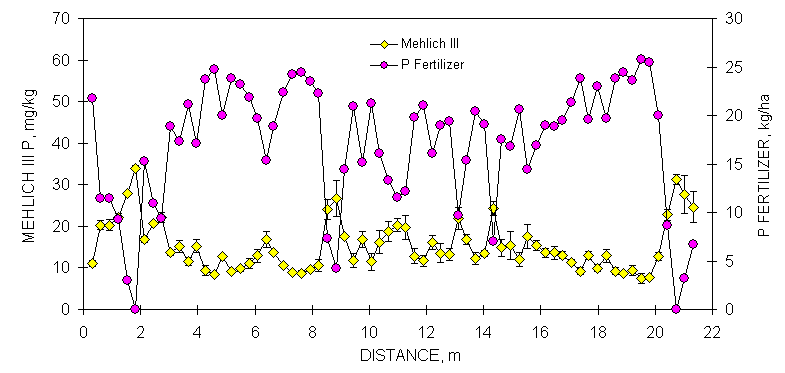
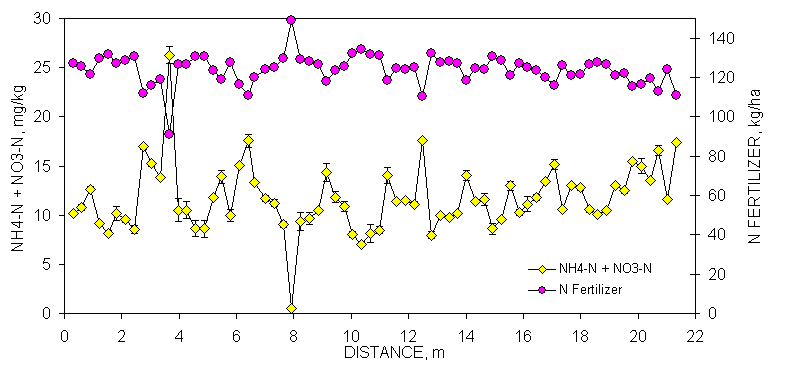
Figure 1. Mean surface (0-15 cm, eight cores/subplot) soil organic C, Mehlich III P, and NH4-N+NO3-N from duplicate samples collected from consecutive 0.30 x 0.30 m plots, associated error bars (1 standard deviation) and fertilizer P and N recommendations based on soil test analyses, in a bermudagrass pasture, Burneyville, OK.
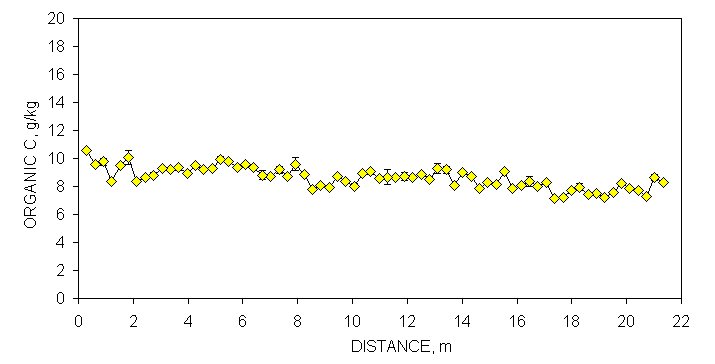
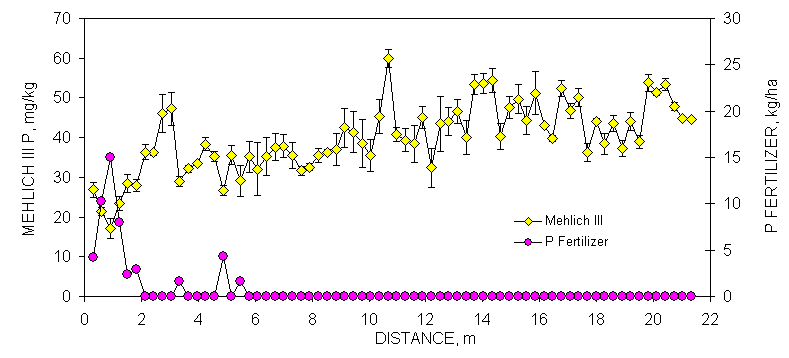
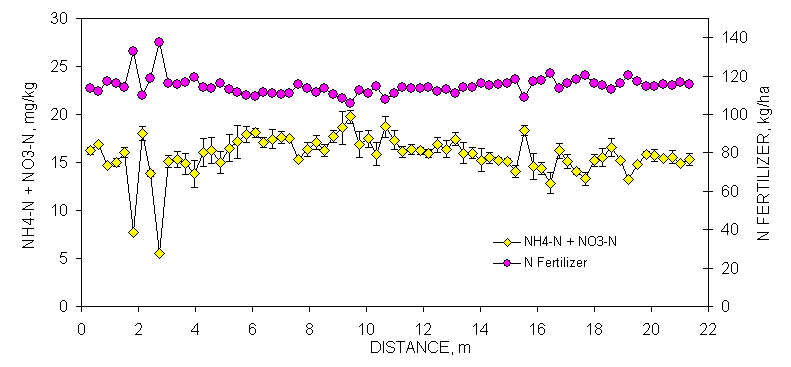
Figure 2. Mean surface (0-15
cm, eight cores/subplot) soil organic C, Mehlich III P, and NH4-N+NO3-N
from duplicate samples collected from consecutive 0.30 x 0.30 m plots,
associated error bars (1 standard deviation) and fertilizer P and N
recommendations based on soil test analyses, in a bermudagrass pasture, Efaw
Experiment Station, Stillwater, OK.
Table 1. Precision of soil test procedures for ten repeated runs of one
sample, Efaw site.
Procedure Mean Standard Coefficient of Minimum Maximum
deviation variation, %
Soil pH† 5.50 0.059 1.1 5.42 5.58
Soil P‡, mg kg-1 37.78 2.07 5.5 33.84 40.17
Soil K‡, mg kg-1 153.40 1.95 1.3 151 156
Total soil N†† , g kg-1 0.934 0.046 5.0 0.874 0.100
Organic C†† , g kg-1 8.243 0.226 2.7 7.880 8.635
NH4-N, mg kg-1ƒ 9.34 0.40 4.3 8.63 10.05
NO3-N, mg kg-1ƒ 2.81 0.11 4.1 2.60 2.98
† - 1:1 soil:water
‡ - Mehlich III
†† - dry combustion
ƒ- 2M KCl extraction
Table 2. Soil sampling error generated from double sampling twenty, 0.30 x 0.30 m subplots (8 cores to a depth of 15 cm).
Sample A B Std. Dev. CV A B Std. Dev. CV A B Std. Dev. CV A B Std. Dev. CV
---------------- Soil pH† ---------------- ----------- Organic C, g kg-1†† --------- -------------- P, mg kg-1 ‡ ------------ ------------- K, mg kg-1 ------------
1 6.17 6.16 0.007 0.1 0.924 1.042 0.084 8.5 17.64 19.96 1.64 8.7 150 142 6 3.9
2 6.27 6.22 0.035 0.6 0.939 0.989 0.035 3.6 17.75 18.59 0.60 3.3 139 143 3 2.0
3 6.09 6.05 0.028 0.5 1.000 1.130 0.092 8.6 23.65 33.34 6.85 24.0 180 140 28 17.7
4 5.64 5.67 0.021 0.4 1.035 1.215 0.127 11.3 29.02 30.50 1.04 3.5 139 143 3 2.0
5 5.82 5.86 0.028 0.5 1.067 0.992 0.053 5.1 20.91 24.07 2.24 9.9 135 135 0 0.0
6 5.64 5.65 0.007 0.1 1.045 1.096 0.036 3.4 25.75 42.93 12.14 35.4 168 180 8 4.8
7 5.75 5.92 0.120 2.1 1.032 0.933 0.071 7.2 29.34 25.54 2.68 9.8 149 160 8 5.0
8 5.75 5.72 0.021 0.4 1.183 1.228 0.032 2.6 31.02 26.81 2.98 10.3 190 183 5 2.6
9 5.69 5.60 0.064 1.1 0.840 0.907 0.047 5.4 37.98 24.59 9.46 30.2 156 146 7 4.6
10 5.51 5.80 0.205 3.6 1.018 1.002 0.012 1.2 38.61 30.50 5.74 16.6 170 165 4 2.1
11 5.58 5.65 0.049 0.9 1.285 1.098 0.132 11.1 52.83 45.98 4.84 9.8 203 190 9 4.6
12 5.62 5.67 0.035 0.6 1.057 1.062 0.004 0.3 35.13 35.03 0.07 0.2 140 141 1 0.5
13 5.64 5.50 0.099 1.8 0.940 0.891 0.035 3.8 38.92 38.40 0.37 0.9 168 166 1 0.8
14 5.89 5.92 0.021 0.4 1.006 0.959 0.033 3.4 26.70 34.81 5.74 18.7 163 154 6 4.0
15 5.70 5.75 0.035 0.6 0.964 0.812 0.107 12.1 35.13 31.34 2.68 8.1 135 133 1 1.0
16 5.72 5.68 0.028 0.5 0.912 0.981 0.049 5.2 43.77 35.34 5.96 15.1 140 168 20 12.8
17 5.58 5.48 0.071 1.3 0.855 0.837 0.013 1.5 40.29 35.45 3.43 9.0 137 100 26 22.1
18 5.59 5.59 0.000 0.0 1.040 0.931 0.077 7.8 31.55 26.91 3.28 11.2 140 95 32 27.0
19 5.77 5.72 0.035 0.6 0.790 0.712 0.055 7.4 28.39 33.66 3.73 12.0 140 144 3 1.9
20 5.83 5.75 0.057 1.0 0.793 0.788 0.003 0.4 31.02 37.13 4.32 12.7 140 144 3 1.9
Average 5.76 5.77 0.048 0.8 0.986 0.980 0.055 5.5 31.77 31.54 3.99 12.5 154 149 9 6.1
Minimum 5.51 5.48 0.000 0.0 0.790 0.712 0.003 0.3 17.64 18.59 0.07 0.2 135 95 0 0.0
Maximum 6.27 6.22 0.205 3.6 1.285 1.228 0.132 12.1 52.83 45.98 12.14 35.4 203 190 32 27.0
Std. Dev. 0.20 0.20 0.048 0.8 0.121 0.136 0.038 3.6 8.85 7.13 3.06 9.0 20 24 10 7.6
Prob |T| 0.80 0.78 0.89 0.18
________________________________________________________________________________________________________________________________
† - 1:1 soil:water
‡ - Mehlich III
†† - dry combustion
CV - coefficient of variation
Prob |T|, probability that the means of two groups (A & B) of observations are equal
Table 3. Mean, standard deviation, minimum and maximum values for soil test, forage yield, forage N and uncalibrated voltage readings for near infrared (NIR), red and green spectral radiance collected from 0.30 x 0.30m plots, Burneyville and Efaw.
Mean Standard Minimum Maximum Coefficient
Variable deviation of variation, %
Burneyville (n=490)
Forage yield, kg ha-1 2905 1591 244 10750 54
Forage N, g kg-1 1.37 0.26 0.14 2.78 19
Forage N uptake, kg ha-1 39.2 23.0 2.4 183.5 59
Soil pH† 5.44 0.22 4.37 6.29 4
Soil NH4-N+NO3-N‡‡ , mg kg-1 11.7 3.4 0.6 26.3 28
N recommendation, kg ha-1 141 - 166 109
Soil P‡, mg kg-1 18.4 9.6 3.1 124.1 52
P recommendation, kg ha-1 11.0 - 30.6 0
Soil K‡, mg kg-1 130.2 37.6 13.0 262.0 29
K recommendation, kg ha-1 0.0 - 106.7 0
Total soil N ††, g kg-1 1.06 0.33 0.44 2.38 31
Organic C ††, g kg-1 11.12 3.58 5.34 25.54 32
C:N 10.5 1.05 6.28 13.98 10
NIR 2098 604 292 3893 29
Red 386 171 36 886 44
Green 978 265 116 1405 27
NDVI 0.685 0.119 0.331 0.909 17
Forage moisture, % 45 10 13 80 22
Efaw (n=490)
Forage yield, kg ha-1 7343 3862 1221 23945 52
Forage N, g kg-1 1.07 0.18 0.63 1.67 16
Forage N uptake, kg ha-1 74.9 33.2 13.8 220.3 44
Soil pH† 5.81 0.19 5.37 6.34 3
Soil NH4-N+NO3-N‡‡, mg kg-1 15.7 2.0 5.5 19.7 13
N recommendation, kg ha-1 133 - 156 124
Soil P‡, mg kg-1 41.8 9.6 15.2 63.7 23
P recommendation, kg ha-1 0.0 - 17.1 0
Soil K‡, mg kg-1 131.4 38.4 12.0 301.0 29
K recommendation, kg ha-1 0 - 107.6 0
Total soil N††, g kg-1 0.88 0.11 0.57 1.25 12
Organic C††, g kg-1 10.37 1.53 7.16 17.17 14
C:N 11.7 1.87 8.31 17.85 16
NIR 1410 115 1074 1719 8
Red 432 47 314 681 11
Green 898 70 714 1170 8
NDVI 0.530 0.044 0.373 0.667 8
Forage moisture, % 25 6 9 50 21
† - 1:1 soil:water
‡ - Mehlich III
†† - dry combustion
NDVI = (NIR-red)/(NIR+red)
‡‡ -2M KCl extract