At what Resolution Should Precision
Agriculture Operate?
At what Resolution Should Precision
Agriculture Operate?As a result of this vision, team members in
soil science began to embark on answering that specific question.
First,
 this
group identified visually homogenous areas and took 8 soil cores from
each 1x1 ft area within a 490 ft2 grid at two locations. These
results were later published in the
Soil Science Society of America Journal (62:683-690). This
work clearly showed that significant differences in soil test properties
(Mehlich III-P, organic carbon, total nitrogen, NH4-N, and NO3-N)
existed at distances less than 3 feet apart
this
group identified visually homogenous areas and took 8 soil cores from
each 1x1 ft area within a 490 ft2 grid at two locations. These
results were later published in the
Soil Science Society of America Journal (62:683-690). This
work clearly showed that significant differences in soil test properties
(Mehlich III-P, organic carbon, total nitrogen, NH4-N, and NO3-N)
existed at distances less than 3 feet apart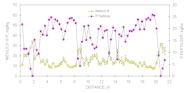 .
This was an alarming finding, considering early 1990's research thrusts
in the grid sampling arena. If you shift the sampling point
(center or corner of each grid) for a grid based system 3-10 feet away,
would it result in an entirely different contour map? The answer
to that was clearly yes. Ensuing work by
Solie et al.1999
showed that in
order to describe the variability encountered in the field experiments,
soil, plant and indirect measurements should be made at the meter or
submeter level.
.
This was an alarming finding, considering early 1990's research thrusts
in the grid sampling arena. If you shift the sampling point
(center or corner of each grid) for a grid based system 3-10 feet away,
would it result in an entirely different contour map? The answer
to that was clearly yes. Ensuing work by
Solie et al.1999
showed that in
order to describe the variability encountered in the field experiments,
soil, plant and indirect measurements should be made at the meter or
submeter level.
 Once these fundamental
questions had been answered, another trial was initiated to demonstrate
the benefits of operating at a 0.84m2 spatial scale
(J. Plant Nutr.
24:313-325). In
the second year of the experiment, there was a trend for a lower N rate
and a higher efficiency of use for the 0.84 m2
resolution. Although this study was inconclusive it was a step in
the right direction in terms of experimental design and rigor required
to evaluate the importance of spatial scales.
Once these fundamental
questions had been answered, another trial was initiated to demonstrate
the benefits of operating at a 0.84m2 spatial scale
(J. Plant Nutr.
24:313-325). In
the second year of the experiment, there was a trend for a lower N rate
and a higher efficiency of use for the 0.84 m2
resolution. Although this study was inconclusive it was a step in
the right direction in terms of experimental design and rigor required
to evaluate the importance of spatial scales.
 To
some extent this study was unsuccessful in demonstrating the benefits of
operating at a resolution of 0.84m2 and smaller, simply because we did
not have the appropriate Nitrogen Fertilization Optimization Algorithm
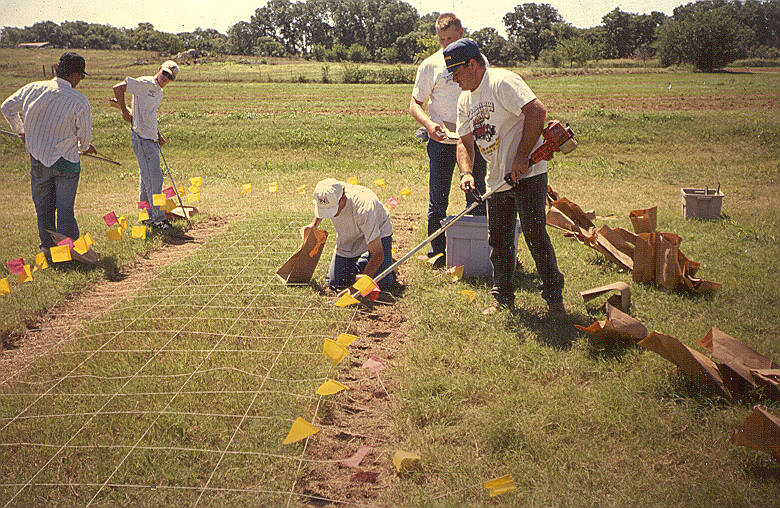
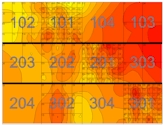
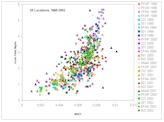
(NFOA) in place. However, contour plots from each of the
experiments conducted by Ms. Joanne LaRuffa, clearly showed that
differences existed at resolutions much smaller than 0.84m2.
Contour plots were generated using one of the more advanced hand-held
optical sensors developed by Dr. Marvin Stone and Dr. John Solie (image
to the right, with 0.84m2 plots).
To
some extent this study was unsuccessful in demonstrating the benefits of
operating at a resolution of 0.84m2 and smaller, simply because we did
not have the appropriate Nitrogen Fertilization Optimization Algorithm
(NFOA) in place. However, contour plots from each of the
experiments conducted by Ms. Joanne LaRuffa, clearly showed that
differences existed at resolutions much smaller than 0.84m2.
Contour plots were generated using one of the more advanced hand-held
optical sensors developed by Dr. Marvin Stone and Dr. John Solie (image
to the right, with 0.84m2 plots).
 That
significant differences in biomass and N fertilizer need exist at
resolutions less than 0.84m2 is undisputed. We simply have too
many examples where differences in nutrient need at scales as small as 7
inches or 0.18m exist in wheat producer fields. Even in some of our
long-term soil fertility experiments that have been managed the same way
for over 30 years, we find significant differences in biomass and grain
yield production over distances less than 1.0m2.
That
significant differences in biomass and N fertilizer need exist at
resolutions less than 0.84m2 is undisputed. We simply have too
many examples where differences in nutrient need at scales as small as 7
inches or 0.18m exist in wheat producer fields. Even in some of our
long-term soil fertility experiments that have been managed the same way
for over 30 years, we find significant differences in biomass and grain
yield production over distances less than 1.0m2.
 How
could such large differences (within plots) be found in a long-term
experiment where management, and fertilization practices had been
exactly the same for 30 years? One thing that was clear from our
microvariability work was that
significant differences in soil texture also existed at scales < 1.0m2.
If texture differences were different, moisture holding capacity would
also be affected and that would likely be visible in plant growth when
moisture was limiting.
How
could such large differences (within plots) be found in a long-term
experiment where management, and fertilization practices had been
exactly the same for 30 years? One thing that was clear from our
microvariability work was that
significant differences in soil texture also existed at scales < 1.0m2.
If texture differences were different, moisture holding capacity would
also be affected and that would likely be visible in plant growth when
moisture was limiting.
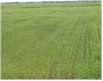
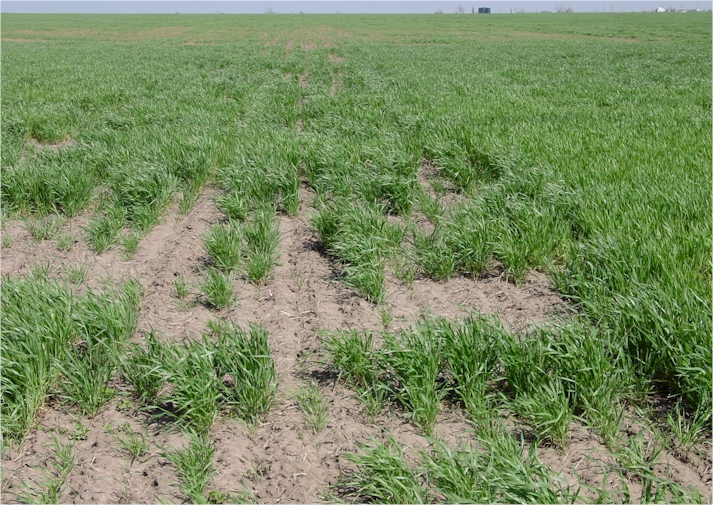
 Who
can argue that the demands for fertilizer in the examples that follow
are profoundly different,
Who
can argue that the demands for fertilizer in the examples that follow
are profoundly different,
 by-row
(both wheat and corn)? Is the 'environmental approach' going to
fertilize each of these rows with the exact same rate, even though need
was entirely different. Is our approach to maximize yields going
to fertilize each of these rows with the same rate even though we
clearly know that one may require 50 kg less N? When corn plants
emerge 3 to 7 days later in a monoculture, these plants can become weeds
because they compete for moisture and nutrients with those plants that
will produce a significant amount of grain. Should we fertilize
each of
by-row
(both wheat and corn)? Is the 'environmental approach' going to
fertilize each of these rows with the exact same rate, even though need
was entirely different. Is our approach to maximize yields going
to fertilize each of these rows with the same rate even though we
clearly know that one may require 50 kg less N? When corn plants
emerge 3 to 7 days later in a monoculture, these plants can become weeds
because they compete for moisture and nutrients with those plants that
will produce a significant amount of grain. Should we fertilize
each of
 these
plants with the same N rate? Our goal must be to recognize the
scale where we know differences exist. In corn, it is clearly by
row, and by plant.
these
plants with the same N rate? Our goal must be to recognize the
scale where we know differences exist. In corn, it is clearly by
row, and by plant.
 If
a system is developed that senses every 2 rows and applies a rate based
on the average, we sacrifice the savings in fertilizer N that we know
exists at that scale and the yield potential that won't be achieved
because we averaged rates for those rows/plants that clearly required
different amounts. The environmental implications and/or
consequences of misapplied N fertilizer are not considered here, but an
appropriate value must be placed on the scale which will deliver
'precision N placement' in agricultural fields.
If
a system is developed that senses every 2 rows and applies a rate based
on the average, we sacrifice the savings in fertilizer N that we know
exists at that scale and the yield potential that won't be achieved
because we averaged rates for those rows/plants that clearly required
different amounts. The environmental implications and/or
consequences of misapplied N fertilizer are not considered here, but an
appropriate value must be placed on the scale which will deliver
'precision N placement' in agricultural fields.
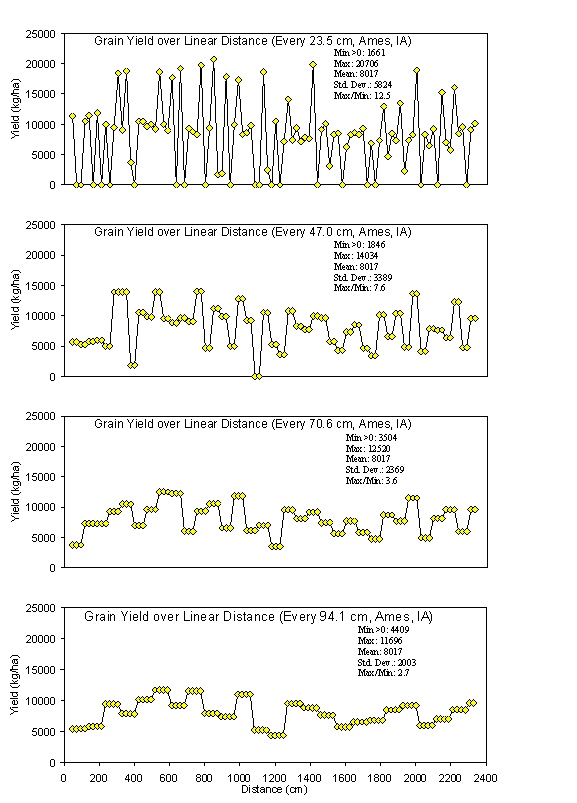
 Early
on, our project focused on predicting yield potential from sensor
readings taken at early stages of growth. Implicit in this work
was the scale at which readings would have to be taken. As a result we
recognized that each 1m2 area had to be sensed independently and that
yield would need to be determined from that same 1m2 area. From
1998 to 2002, we compiled data from 28 locations over this 5-year period
and developed an index (In-Season-Estimated-Yield or
INSEY) capable of predicting yield potential using in-season optical
sensor based measurements. This INSEY index has now been
significantly modified from earlier versions, however, one thing remains
the same and that is the resolution or scale at which sensor
measurements were taken and the ensuing grain yield. Would we have
been able to demonstrate this relationship using a resolution of 10m2?
This is highly unlikely considering the variability that we have
encountered in agricultural fields.
Early
on, our project focused on predicting yield potential from sensor
readings taken at early stages of growth. Implicit in this work
was the scale at which readings would have to be taken. As a result we
recognized that each 1m2 area had to be sensed independently and that
yield would need to be determined from that same 1m2 area. From
1998 to 2002, we compiled data from 28 locations over this 5-year period
and developed an index (In-Season-Estimated-Yield or
INSEY) capable of predicting yield potential using in-season optical
sensor based measurements. This INSEY index has now been
significantly modified from earlier versions, however, one thing remains
the same and that is the resolution or scale at which sensor
measurements were taken and the ensuing grain yield. Would we have
been able to demonstrate this relationship using a resolution of 10m2?
This is highly unlikely considering the variability that we have
encountered in agricultural fields.
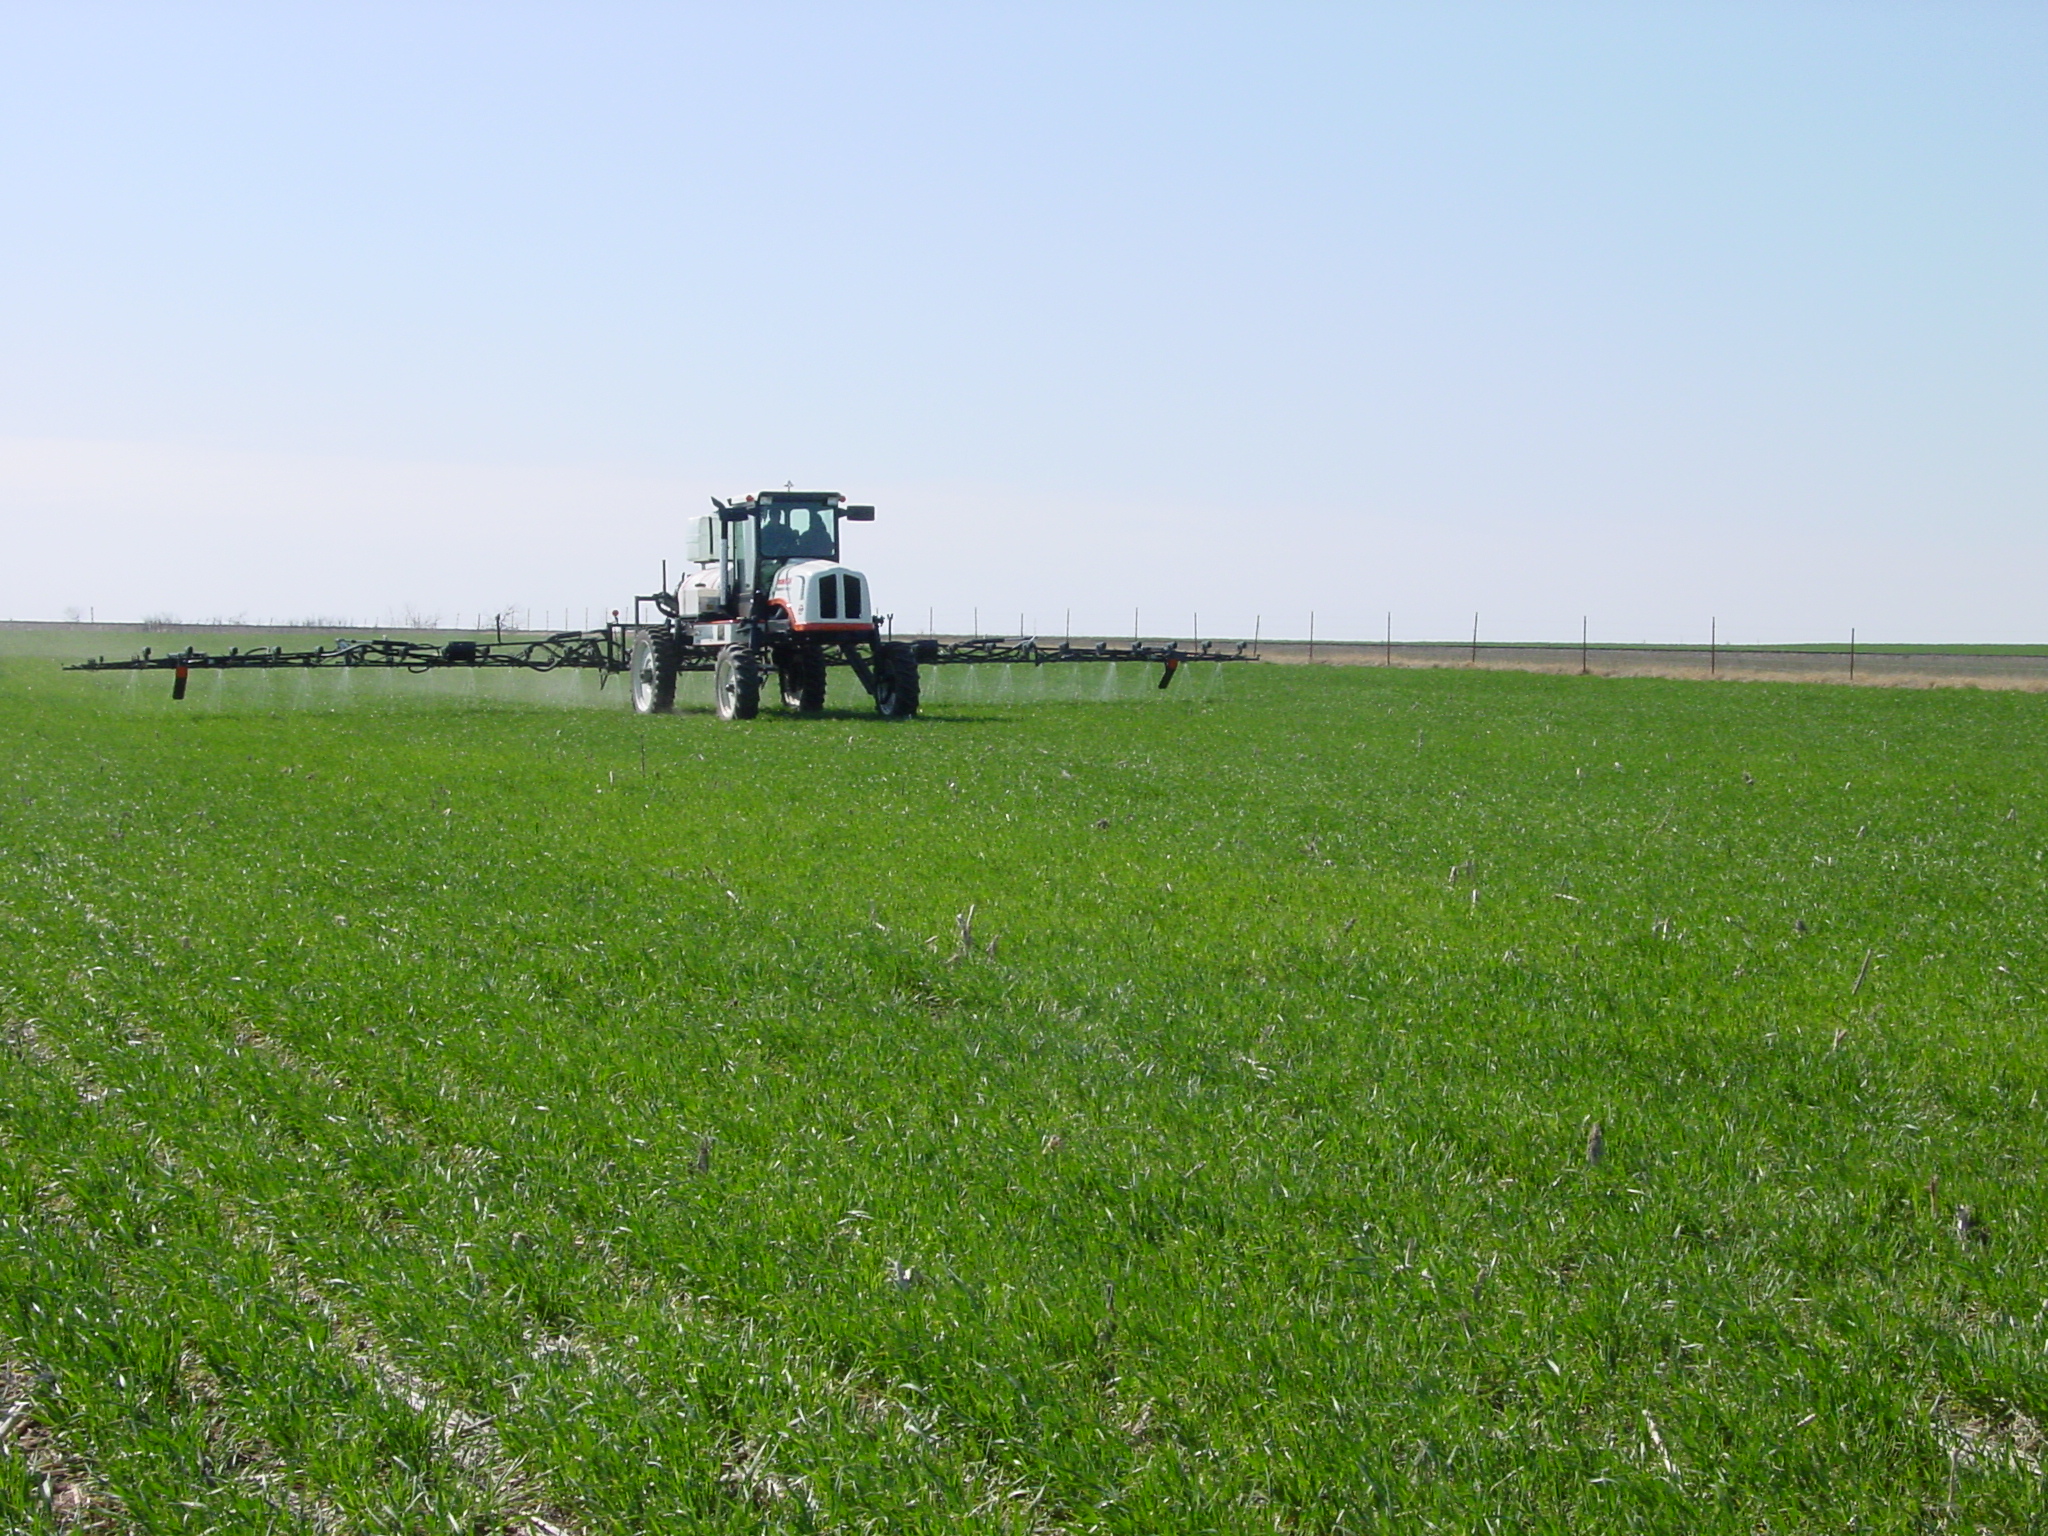
Most recent efforts have focused on the
evaluation of a Field-Scale-Variable-N-Rate-Applicator developed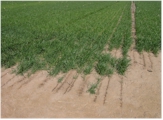 jointly by Oklahoma State University and
NTech Industries.
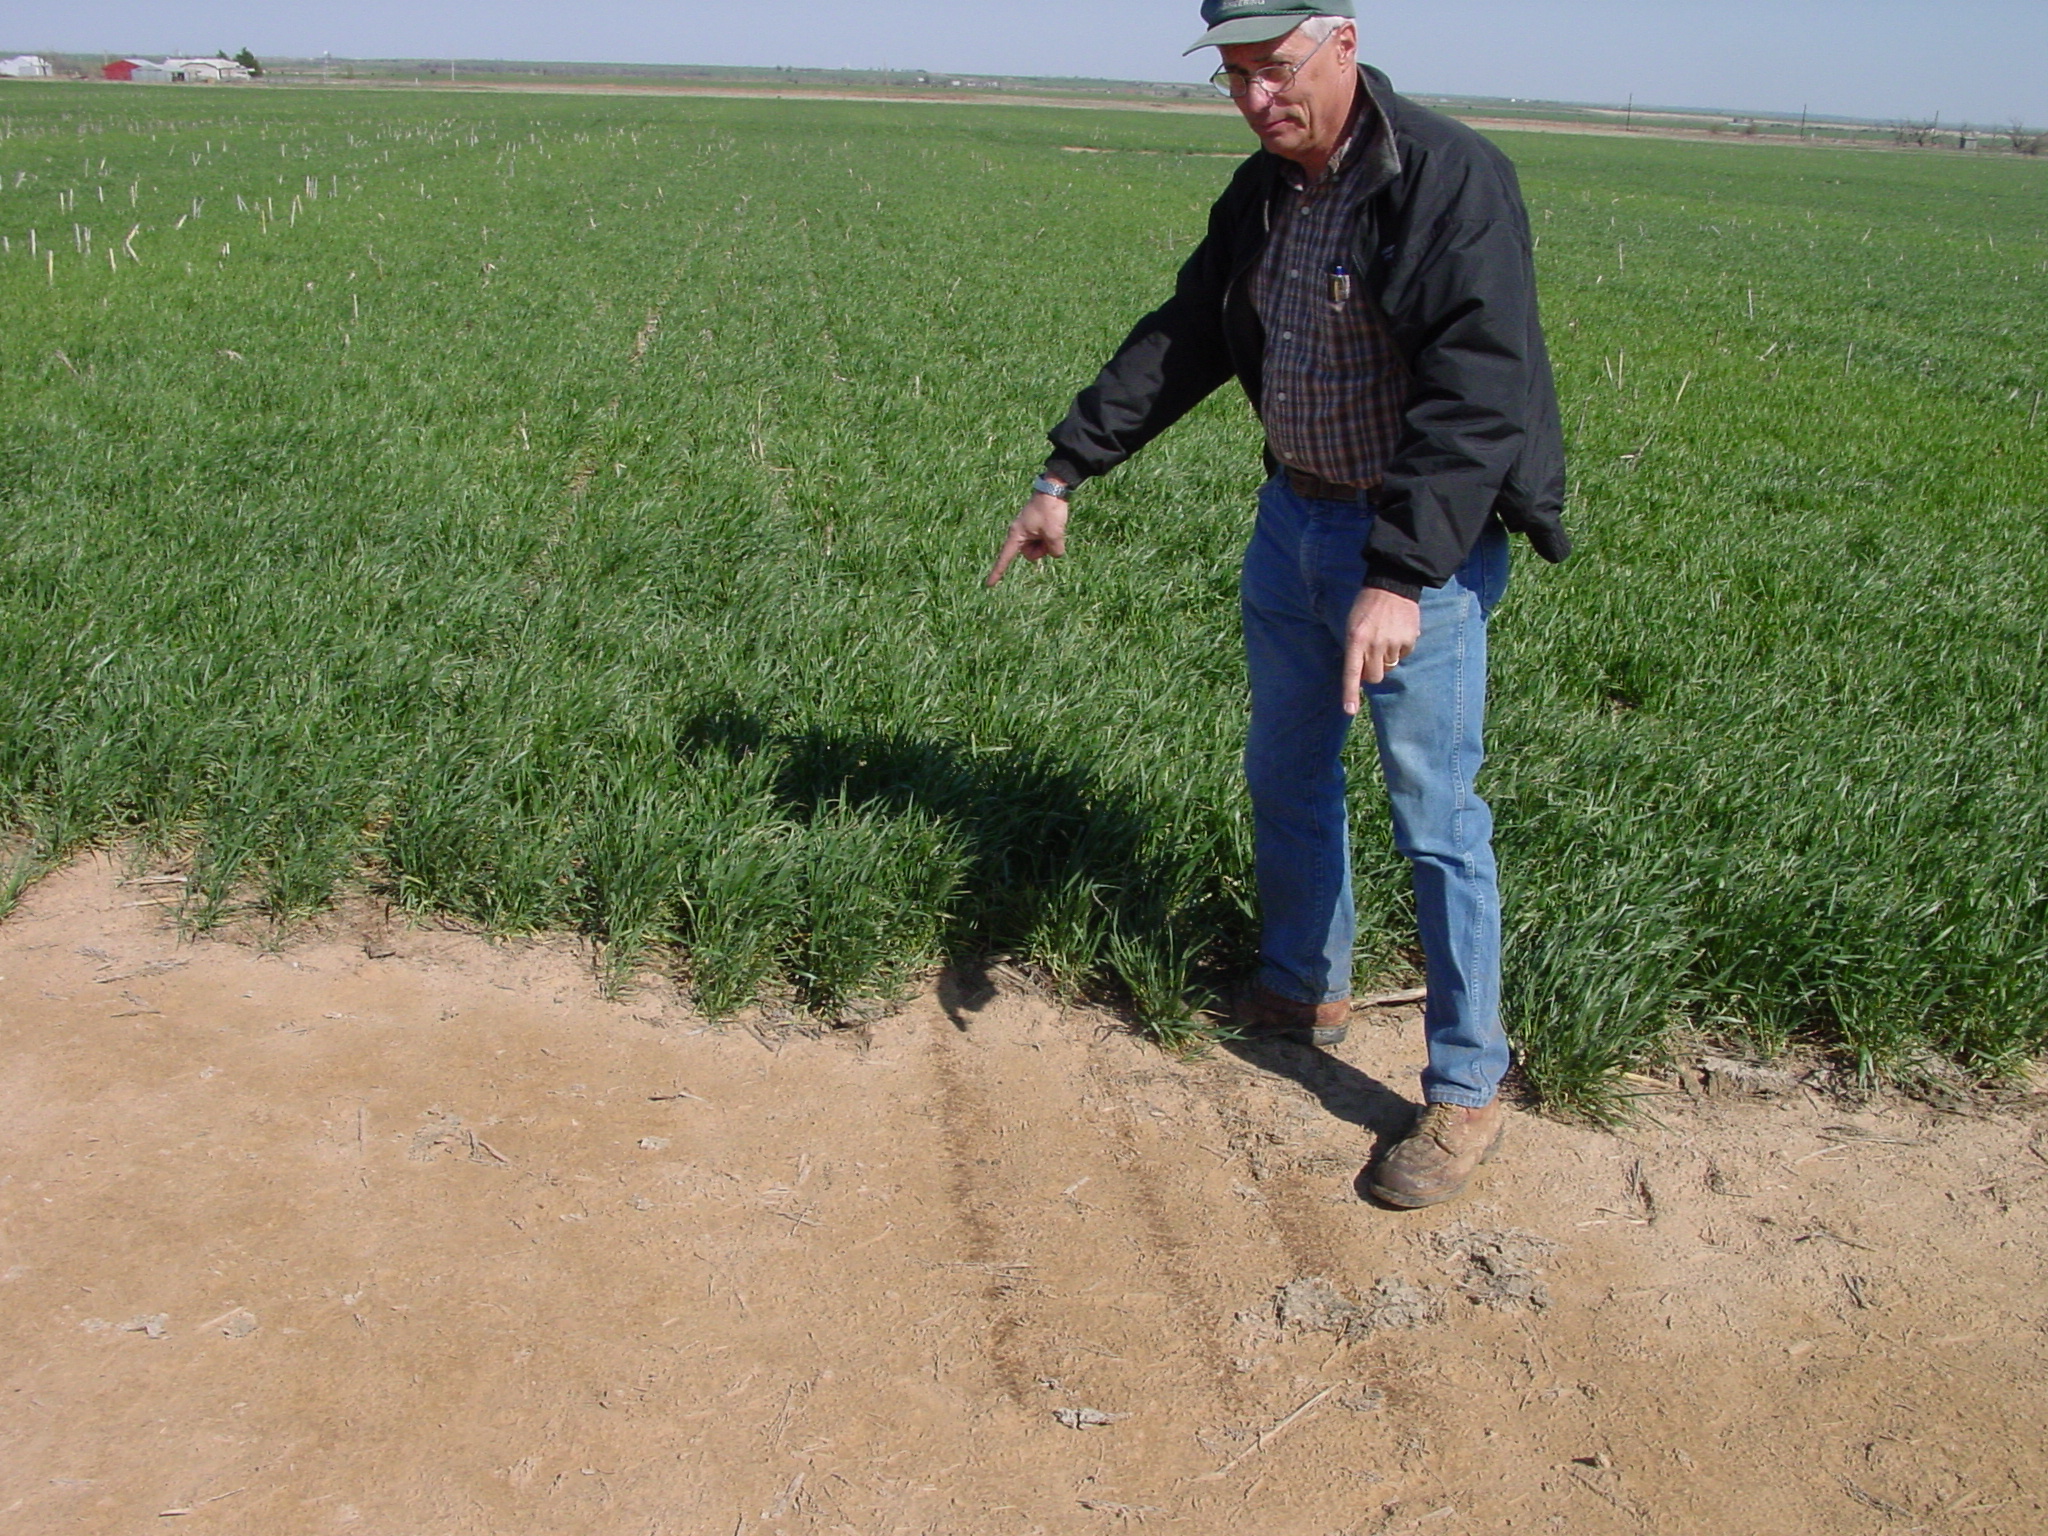
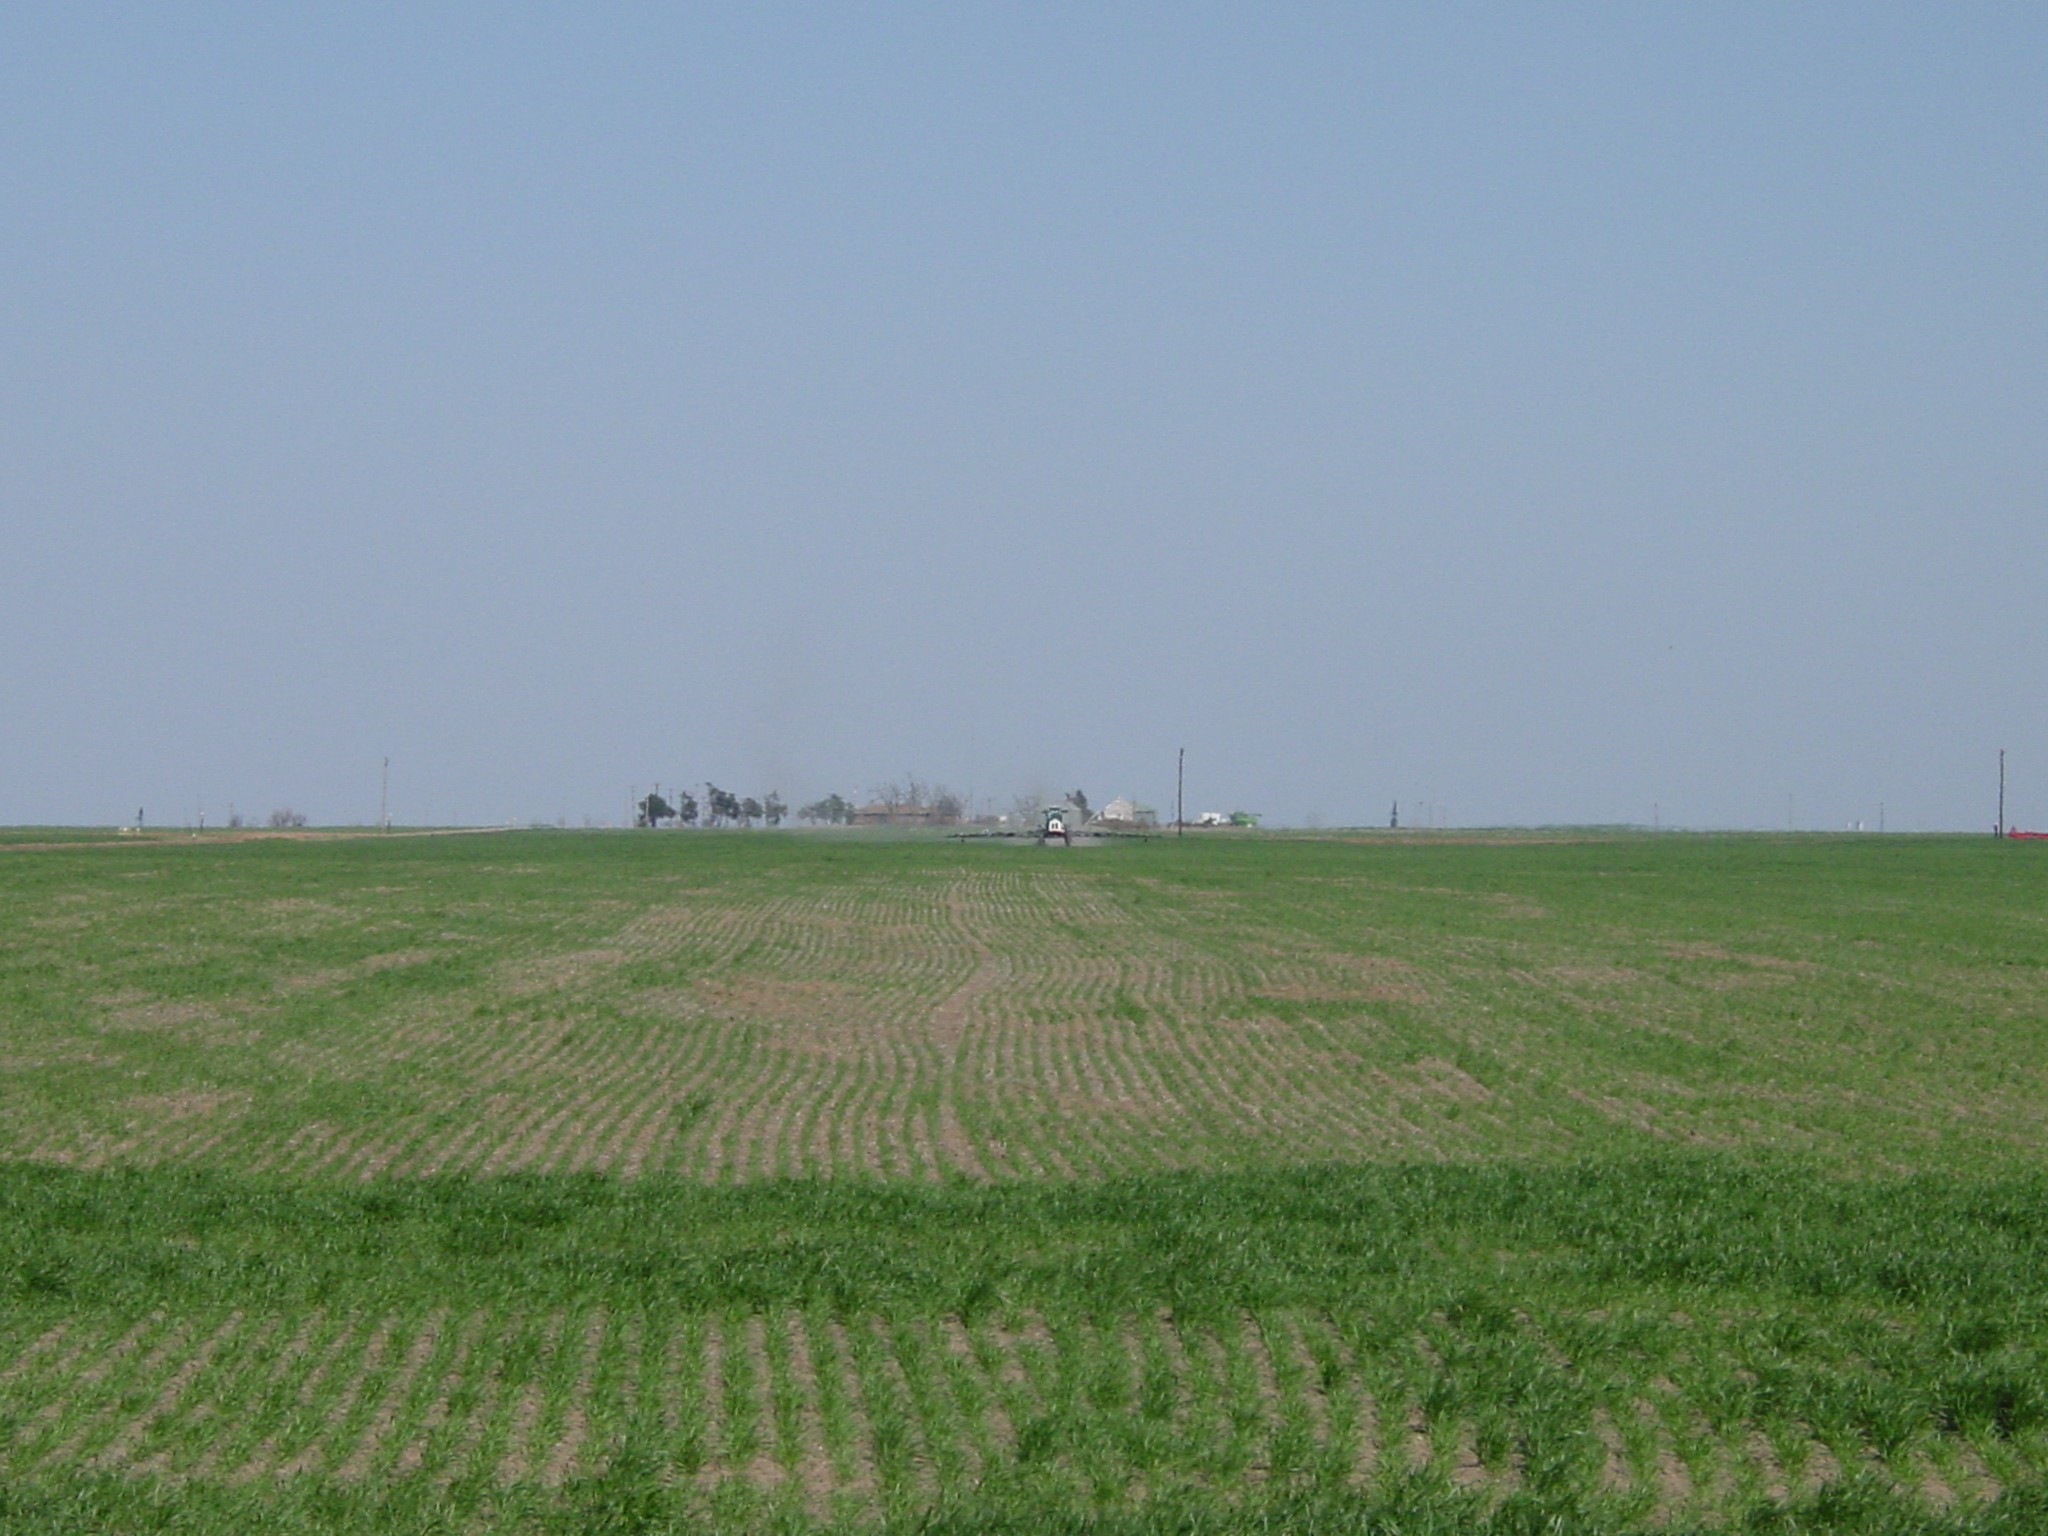
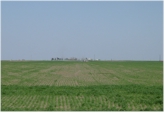
Recognizing a problem area in Hennessey where there simply was no wheat
was important (traveling vertically across a horizontal area where no
wheat grew due to excessive moisture/ponding). In several cases we
found that the sensor could miss by as much as 6 to 12 inches.
What if we had been traveling the other direction (parallel with the
problem) using a resolution of 10m2? Would we recognize the areas
where there was no wheat? Based on averages, we would just
fertilize the bare soil and the growing wheat with the same rate.
This would really be environmentally sensitive!
jointly by Oklahoma State University and
NTech Industries.
Recognizing a problem area in Hennessey where there simply was no wheat
was important (traveling vertically across a horizontal area where no
wheat grew due to excessive moisture/ponding). In several cases we
found that the sensor could miss by as much as 6 to 12 inches.
What if we had been traveling the other direction (parallel with the
problem) using a resolution of 10m2? Would we recognize the areas
where there was no wheat? Based on averages, we would just
fertilize the bare soil and the growing wheat with the same rate.
This would really be environmentally sensitive!
Has our project clearly demonstrated that there are economic benefits of working at the 0.4 to 1.0m2 resolution? Recent results demonstrated that averaged over 4 locations, NUE was improved by >15% when N fertilization was based on optically sensed INSEY, determined for each 1m2 area and a Response Index compared to traditional practices at uniform N rates (Agron J. 94:815-820). This same work showed that VRT treatment at the 1m2 resolution versus flat N rates (common practice employed today) resulted in revenue gains approaching 30$/ha. Did we evaluate VRT at a scale of 2.0m2? No. Why? Because we matched the scale at which we knew we could detect differences in yield potential and that would be the same scale where different nutrient needs would be present. This part of what we have done is quite simple.
Our recent Field-Scale VRT experiments clearly showed the economic benefits of sensing and treating at the 0.4m2 scale versus flat rates. At those sites where the total preplant and topdress rates were similar (VRT vs VS2), the VRT treatment resulted in a net gain of $12.00 per acre. We do not have a 2.0m2 resolution VRT treatment to compare this to. However, all of the research that we have conducted over the years documents the need to operate at a scale finer than 1.0m2 and one that should not be compromised.
All of the 10 field-scale VRT trials that
our team put out this past year had demonstrated spatial scale
differences at the 1.0m2 resolution.
 We
know that and we have known this for a long time. If our group
decides to develop an applicator that works at a much coarser scale than
the one where we know differences in need exist and where differences in
resultant yield potential exist, it is because we chose to bury our
heads in the sand, not because we didn't have the scientific information
available.
We
know that and we have known this for a long time. If our group
decides to develop an applicator that works at a much coarser scale than
the one where we know differences in need exist and where differences in
resultant yield potential exist, it is because we chose to bury our
heads in the sand, not because we didn't have the scientific information
available.
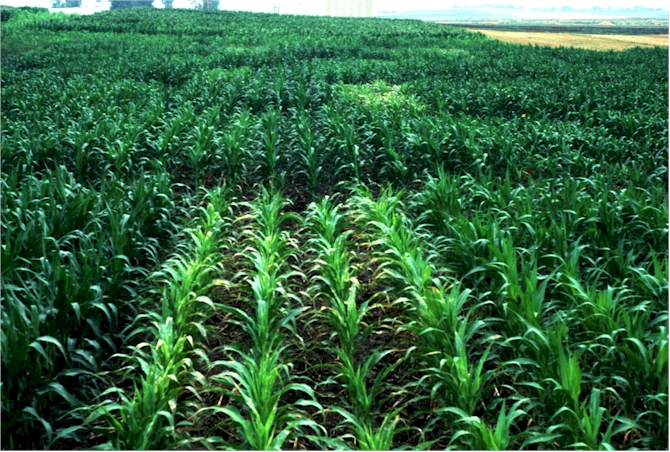
Our most recent results in corn demonstrate
the
repeatable by-plant differences sensed with the
GreenSeeker
hand-held unit that is now commercially available via NTech
Industries.
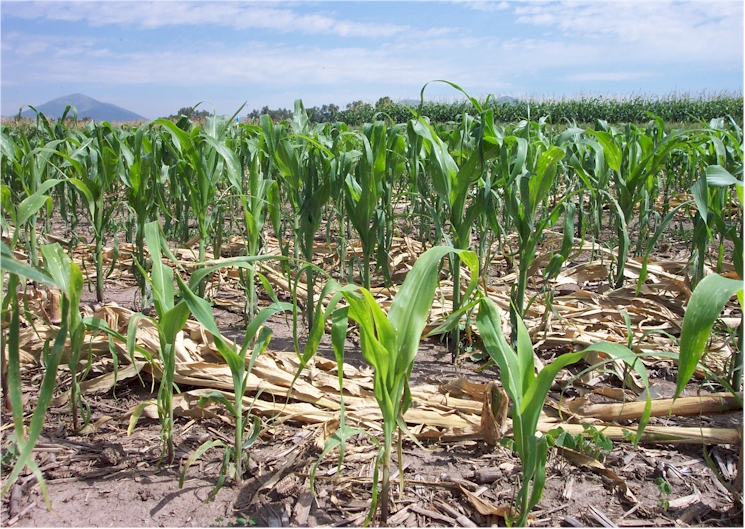
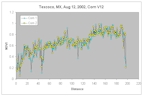 Finding
repeatable NDVI readings ranging from 0.4 to 0.9 within the same row
demonstrates that not only does the variability exist, but that we can
recognize it! Should we now chose to ignore it? If these
differences can be recognized within row, the by-row differences (left
and right) are a must for variable N rate application.
Finding
repeatable NDVI readings ranging from 0.4 to 0.9 within the same row
demonstrates that not only does the variability exist, but that we can
recognize it! Should we now chose to ignore it? If these
differences can be recognized within row, the by-row differences (left
and right) are a must for variable N rate application.
Our field-scale applicator clearly demonstrated the economic benefits of operating at the 0.4m2 scale (in spite of many agronomic and engineering problems encountered during the winter of 2002). Even though there has not been significant interest in terms of purchasing equipment that operates at the 0.4m2 scale, it does not beg off the issue of where we ultimately need to operate. This question has been clearly answered and it is one area where many precision agricultural teams have simply missed the mark in terms of doing what is right versus doing what is possible. We must continue to do what is right and to develop solutions to the problems that we know exist in the field.
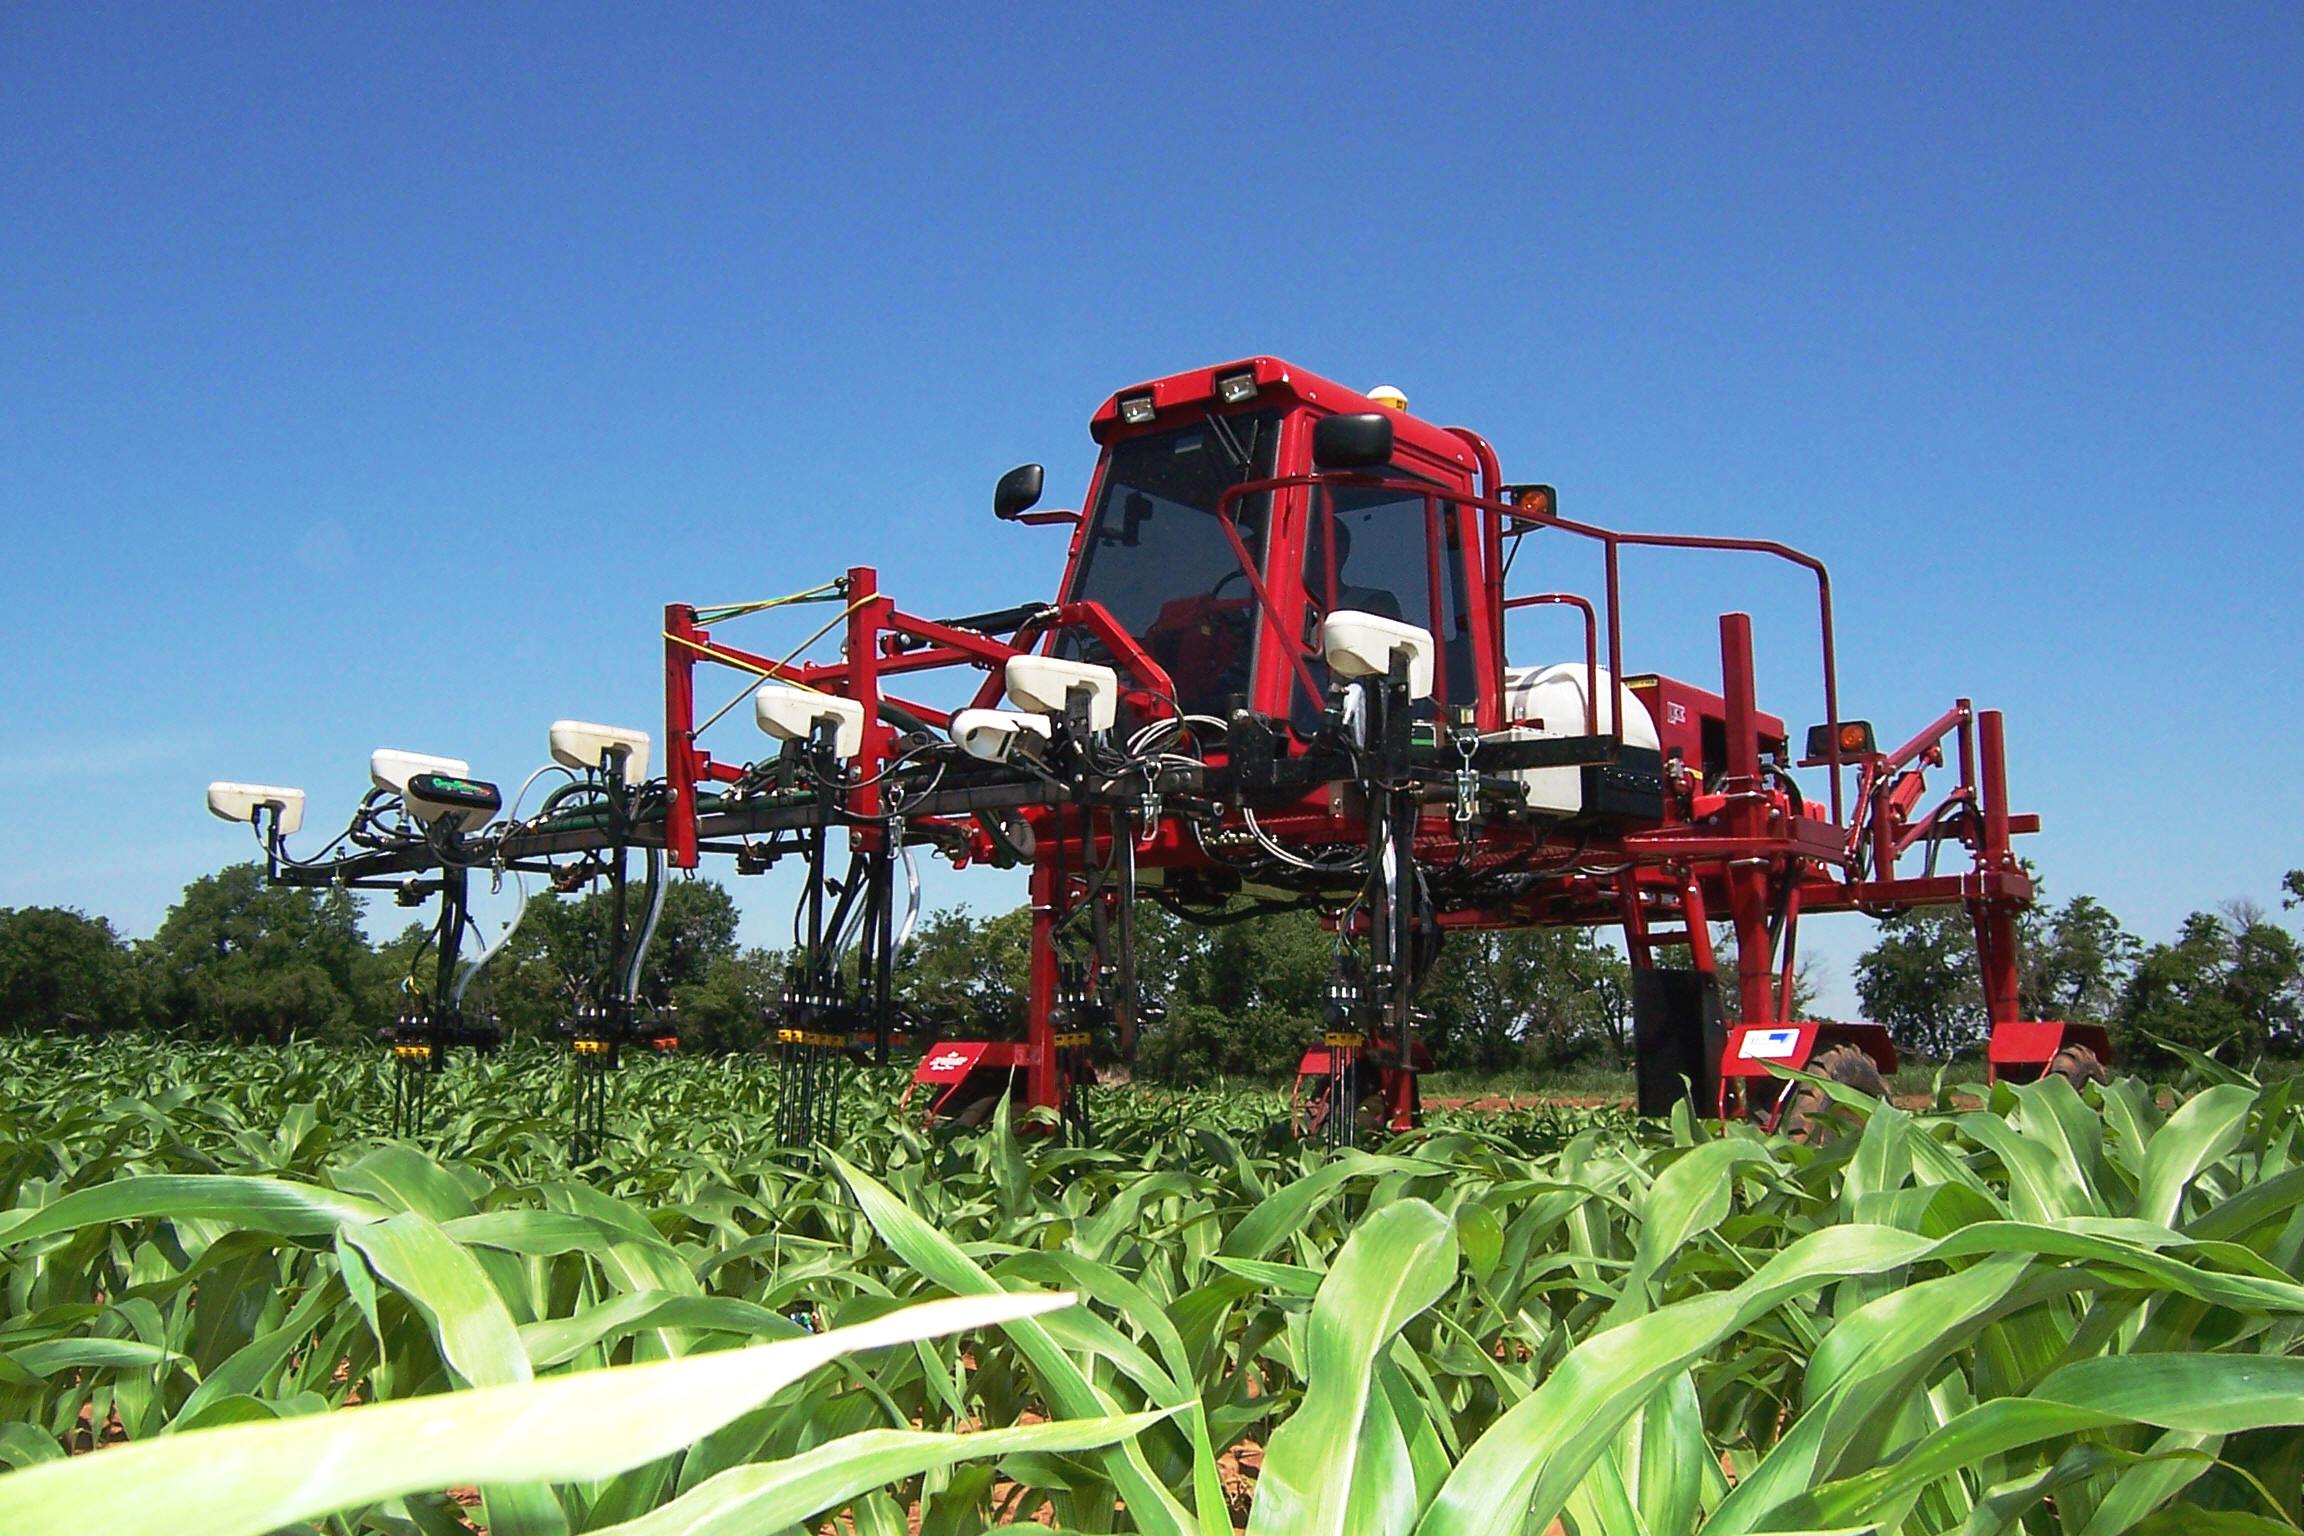 Today, we can sense and fertilize every individual
corn plant on-the-go, using GreenSeeker NDVI sensors. The need for
having this kind of accuracy at very small scales is clearly illustrated
in the corn photos, and graphs below
Today, we can sense and fertilize every individual
corn plant on-the-go, using GreenSeeker NDVI sensors. The need for
having this kind of accuracy at very small scales is clearly illustrated
in the corn photos, and graphs below