
 National Soil Tilth Laboratory (NSTL) in Ames, Iowa
University of Nebraska, Field Testing, SBNRC
By-plant prediction of corn grain yield using optical sensor readings and measured plant height. J. Plant Nutr. 35: 1429-1439.
Expression of spatial variability in corn (Zea mays L.) as influenced by growth stage using optical sensor measurements (Agron J. 99: 384-389) (pdf)
Plant to Plant Variability in Corn Production ( Agron. J. 97:1603-1611) (pdf)
 Collaborative Research, Lincoln, NE,
Jim Schepers, Dennis Francis
Collaborative Research, Lincoln, NE,
Jim Schepers, Dennis Francis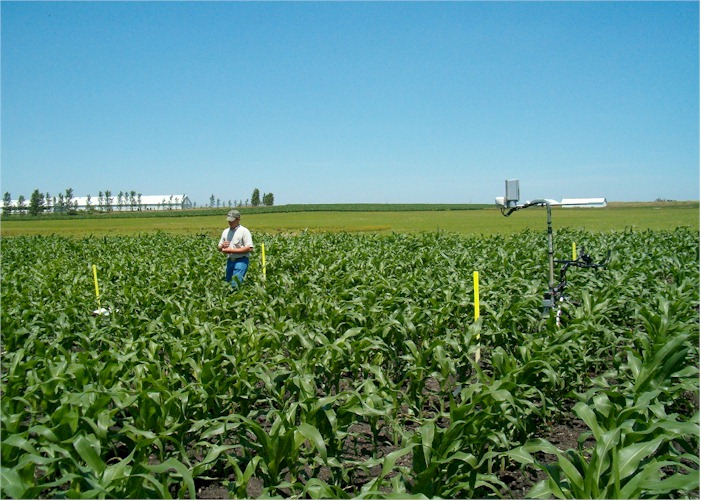
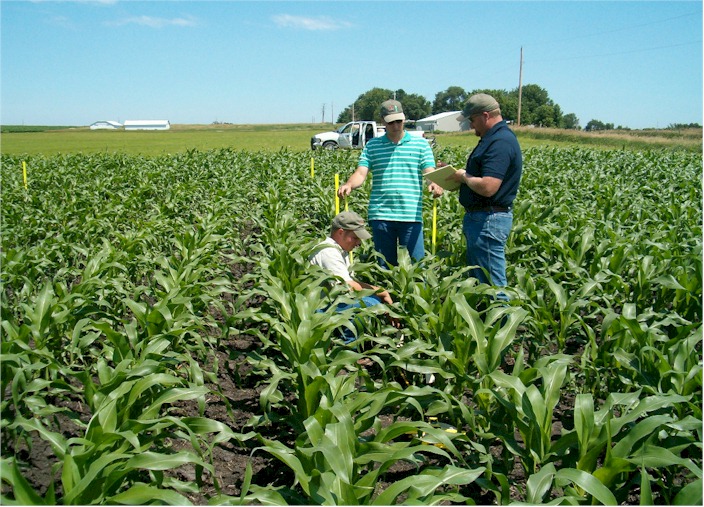
Kent Martin, MS Student at OSU prepares to take by-plant sensor readings from a site just North of the Iowa State University Campus on June 23, 2004. 100 plants were marked, from 2 separate rows (starting point was the second yellow stake in each row moving from North to South). Both NDVI readings using the GreenSeeker sensor and sonar (estimate of plant height) were collected by-plant from this corn field (planted on _____, using the _____ hybrid).
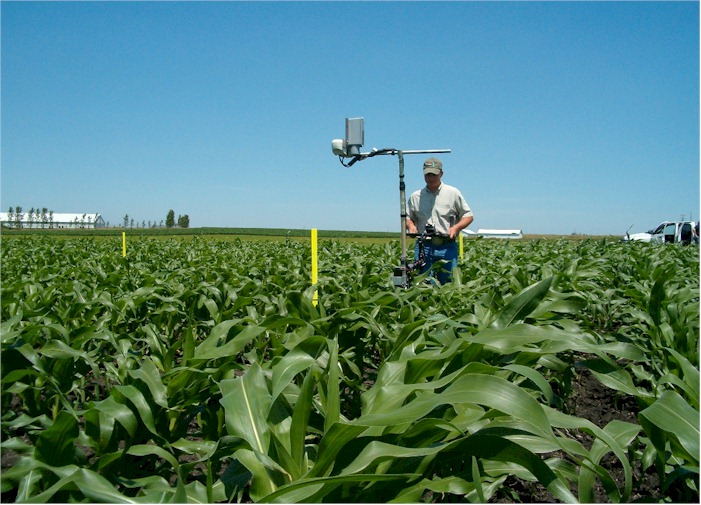
The GreenSeeker sensor mounted on this bicycle unit has a shaft encoder
that records distance traveled as a function of each and every plant.
Using this device, by-plant NDVI readings can be partitioned into a data
file that will later be matched up with final grain yield (also by-plant).
Every 5th plant in this field was marked with a small card (tied to the
base of the stalk) so as to keep these in order at harvest time. If
for example at harvest it was noticed that a plant was missing between #15
and #10 (both were tagged), inspection as to which plant was gone
(damaged, deer consumption, etc.) would allow for the removal of this from
the data base. For this work, the actual order of each plant within
a row and its plant # is critical, because regression will be used to
correlate by-plant NDVI readings collected at V8 with final grain yield.
If the harvest sequence were off by only 1 plant (shifted upwards or
downwards because one plant was missing), the later regression analyses
(by-plant NDVI with by-plant grain yield) is rendered useless.
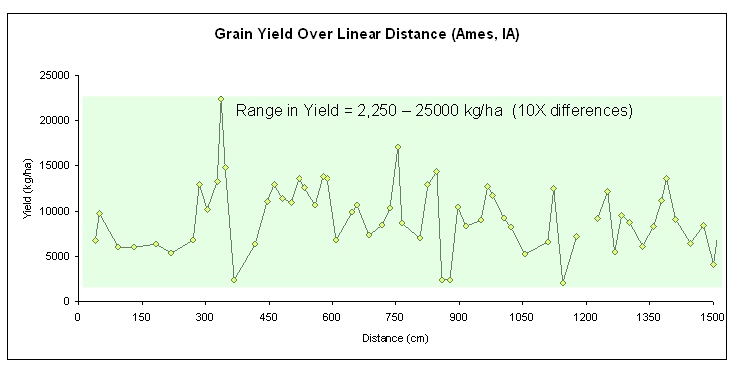
Mean: 9496.17 kg/ha
Standard Deviation: 3737.60 kg/ha
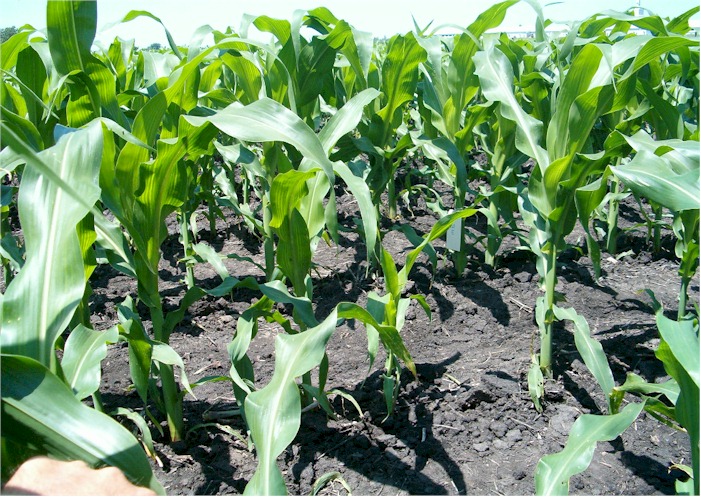
Kent Martin (OSU), Jason Lawles (NTech Industries) and Kyle Freeman (OSU Ph.D Student) collect actual distances between each corn plant (100 plants per row, 2 rows). This information will be used to determine yield per unit area that each plant occupies. Because some plants occupy more actual area as a function of spacing to and from neighboring plants, yield must be determined based on that area. Although plant spacing is in general considered to be "uniform" this is not at all the case when measured under "field conditions." The example below (same Iowa field pictured above) illustrates a smaller plant that occupies a significant area (versus its neighbors), and that is unlikely to produce an ear (later competition and canopy closure will seriously restrict yield). By-plant sensor measurements at V6-V8 have been shown to be highly correlated with final grain yield in other studies in Oklahoma, and Mexico, and that employed individual plant height measurements. Because of this, early-season sensor measurements are used to adjust by-plant fertilizer N rates using technology developed by NTech Industries, Oklahoma State University, University of Nebraska (USDA-ARS-Jim Schepers and Dennis Francis), and NSTL (Jerry Hatfield).
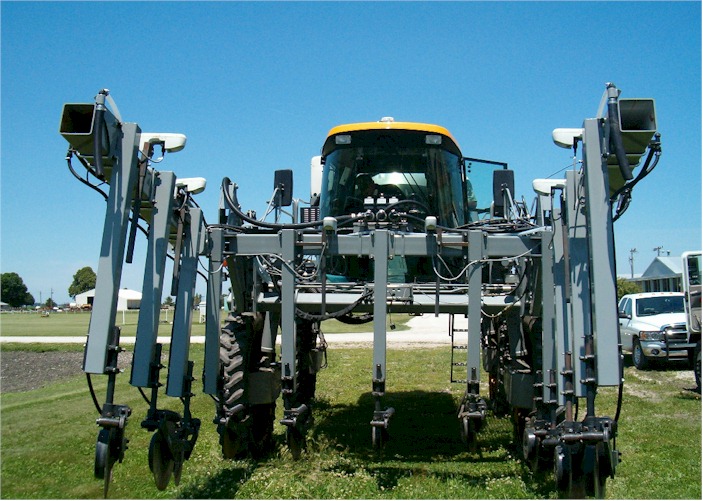
Dr. Jerry Hatfield has teamed up with NTech Industries, and HAGIE to develop a sidedress corn applicator capable of sensing and fertilizing corn on-the-go using the GreenSeeker sensors. This applicator is currently at the Iowa State University Research Center located just west of Ames.
Ames, Iowa, June 23, 2004. East row (100 plants) sensed using the GreenSeeker sensor with shaft encoding for distance, pass 1 and pass 2 superimposed on one another. The reproducibility of the sensor readings (taken at different times) is evident on this graph. Also, the sensor readings by plant plotted against one another (taken at different times) is illustrated below.
Causes
of By-Plant Variability in Corn Production Systems
Spatial
Variability of N, What is the Scale?
Agronomy Journal 91:357
Yield level and Nitrogen response are Independent (corn and wheat) J. Prec. Agriculture 12:508-518
