Also
see predicting corn grain yields
Also
see predicting corn grain yields
 Library of
Yield Prediction Equations
Library of
Yield Prediction Equations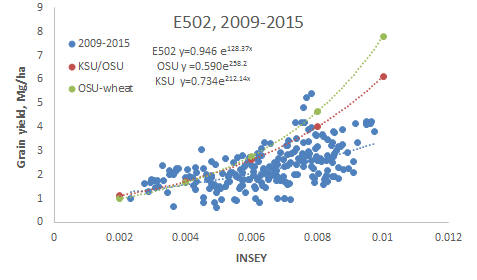
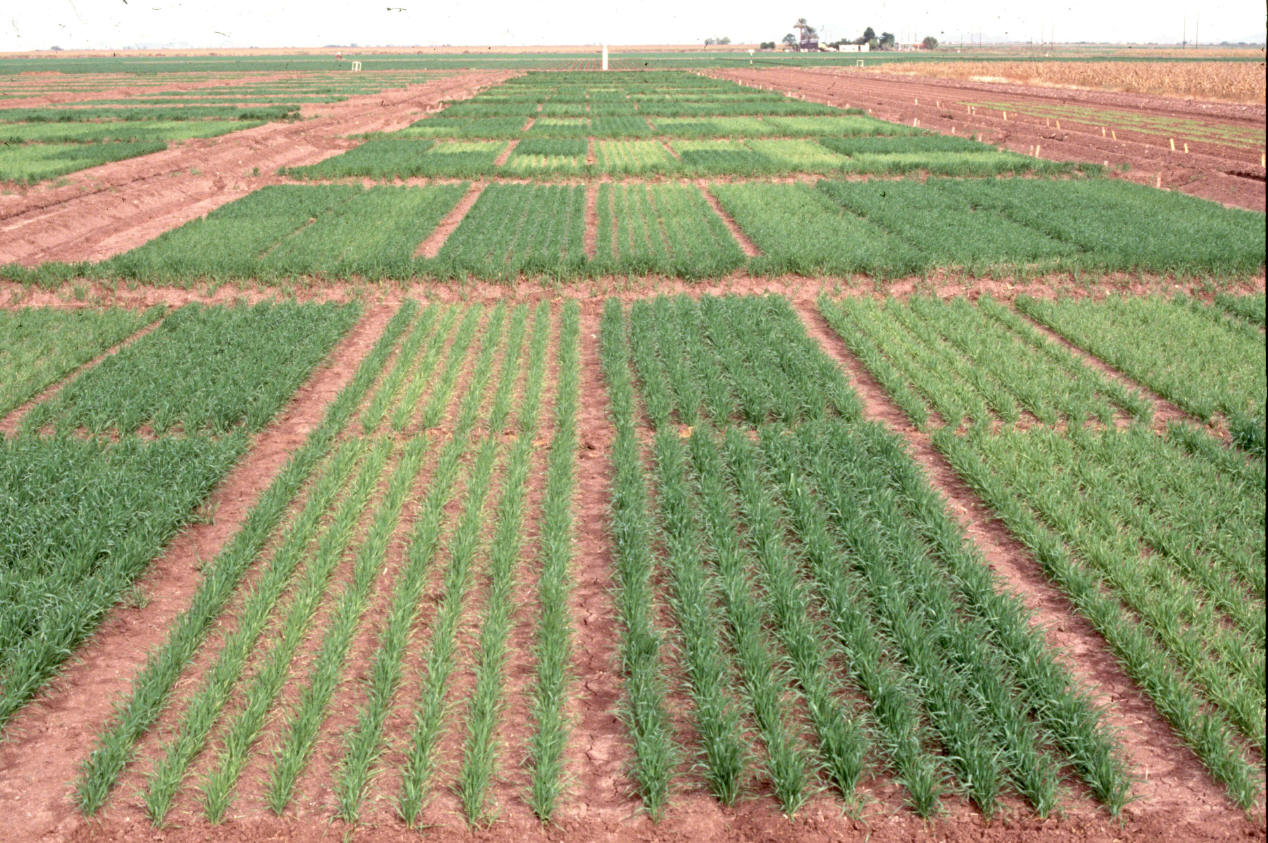
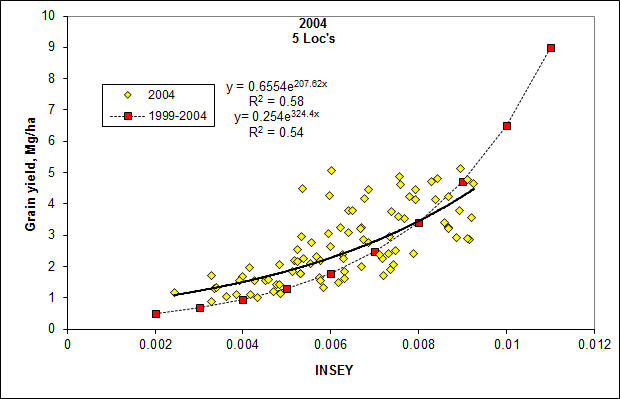
Experiment 502, Lahoma, OK, predicting of wheat grain yield using INSEY (NDVI/GDD).
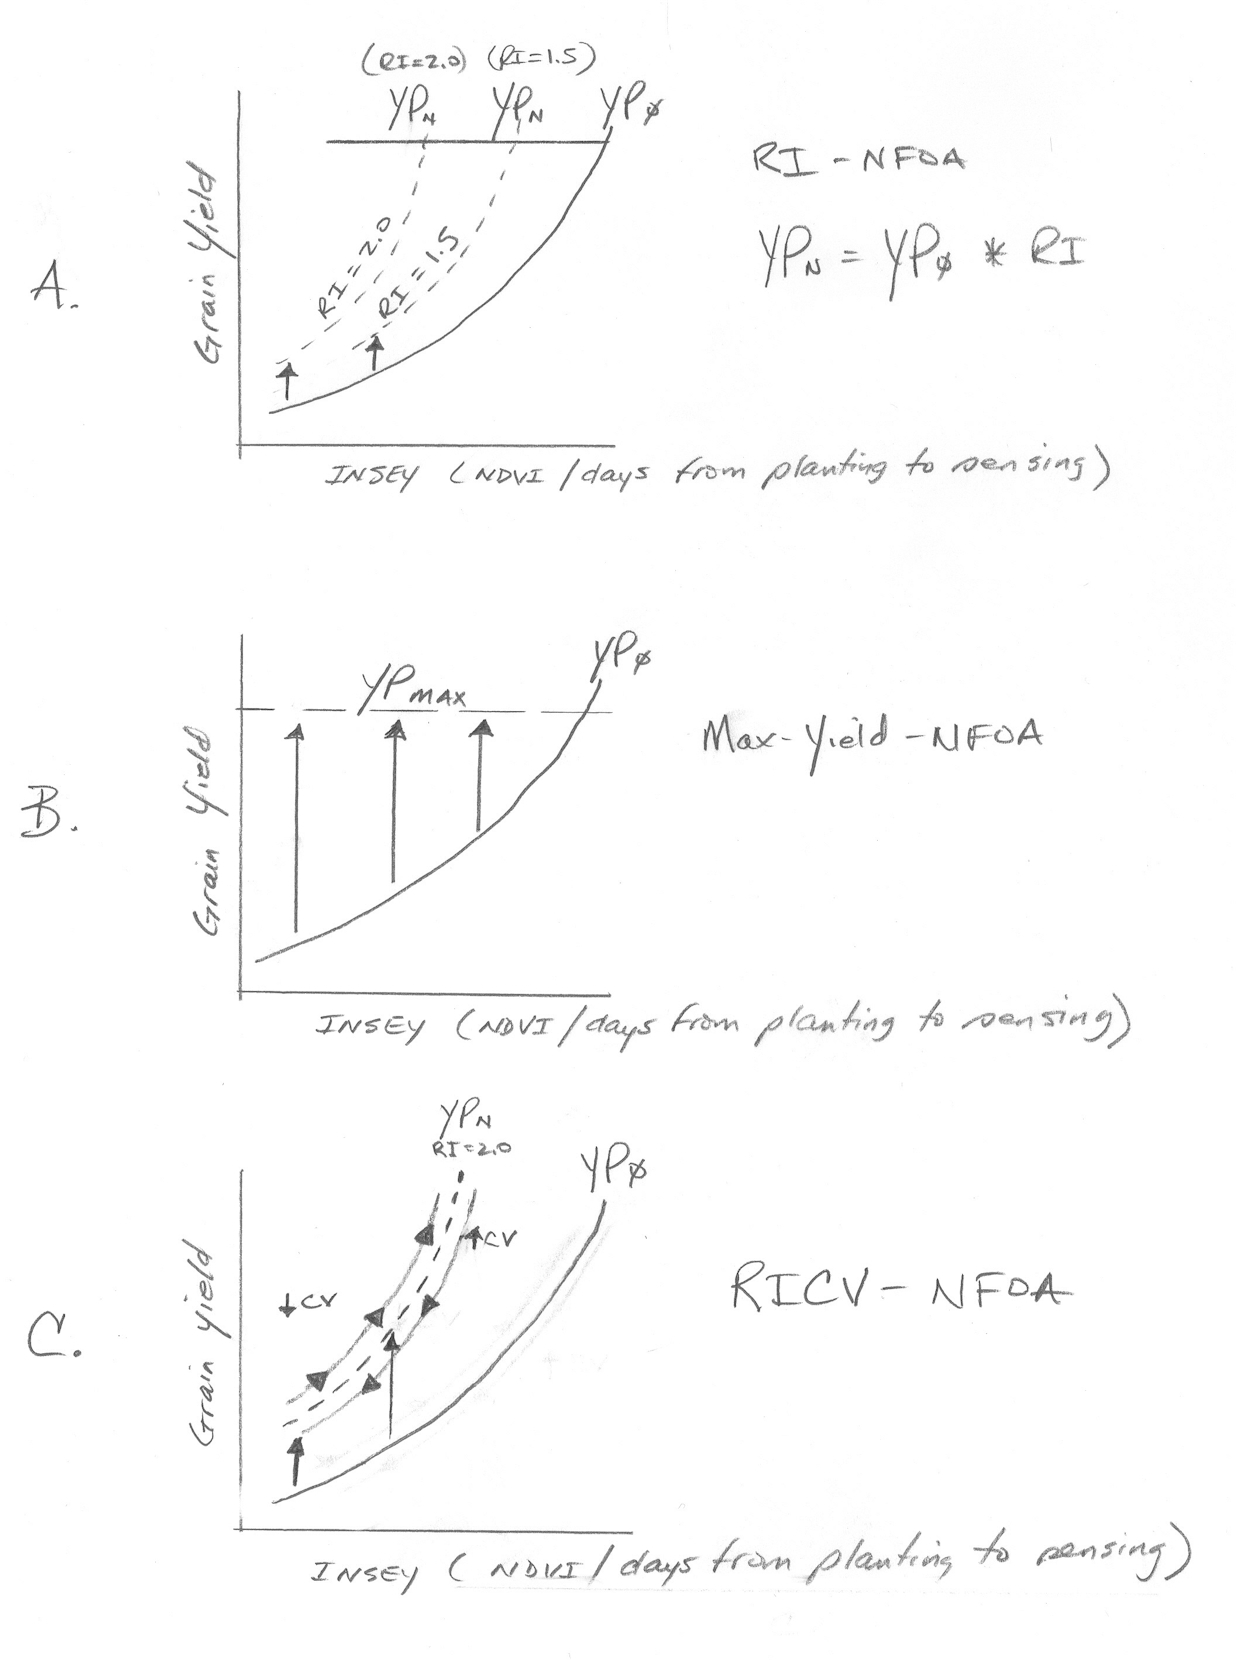
In the figure above 4 yield potential equations are reported for winter
wheat, spring wheat, dryland corn and irrigated corn. As is noted,
the 4 equations are really quite similar. This is important when
considering that the winter wheat equation came from data in Oklahoma,
spring wheat from North Dakota, South Dakota, and Mexico, and Corn (both
irrigated and dryland), from Mexico, Nebraska, and Oklahoma. Each
production region (country or state specific) may well have minor
adjustments that are needed (variety, planting date, etc.), but for the
most part these yield potential predictive equations should be accurate.
Regardless, what is apparent here is that all grain yield prediction
equations will have the same form. The importance of the yield potential
equations is that they accurately reflect what the "yield potential"
will be for the growing conditions encountered within a specific year.
"Yield potential" changes from year to year in the exact same field,
largely due to temporal variability. Also, looking at the graphs,
our estimate of yield potential is the "yield" you hope to grow given
the "current" growth rate (on the day of sensing), thus, the outer edge
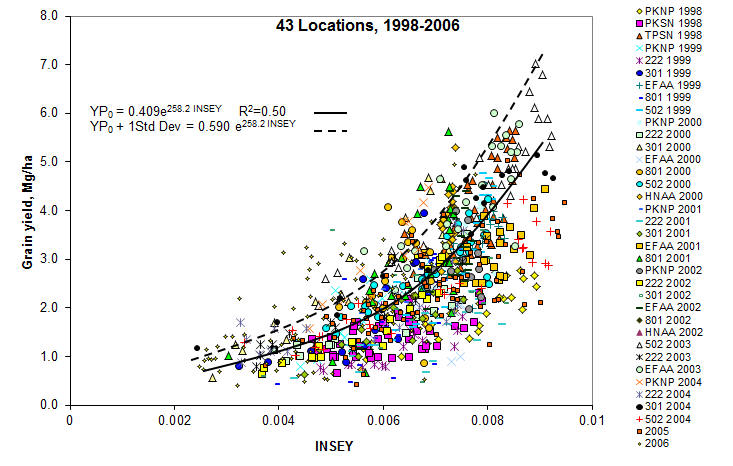
of the data set is used, and estimated by adding 1 standard deviation
along the entire exponential curve. For all crops (see figures
below), very few data points were encountered in the upper left hand
corner, noting that this outer edge represented a rather clean upper
boundary. As is noted above, the YP0 equation for wheat is
somewhat different that the other crops, largely because many of the
days from planting to sensing have GDD<0 (growing degree days or
Tmin+Tmax/2 - 4.4°C), where growth is not possible. The growth
curve (biomass produced per day), estimated using NDVI (excellent
predictor of biomass) has proven to be a reliable parameter for
estimating harvested grain yield in winter wheat, spring wheat, and corn
(both dryland and irrigated). Actual data for all equations is shown
below.
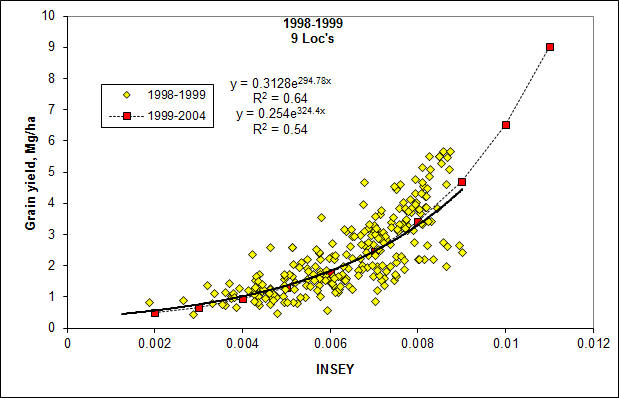
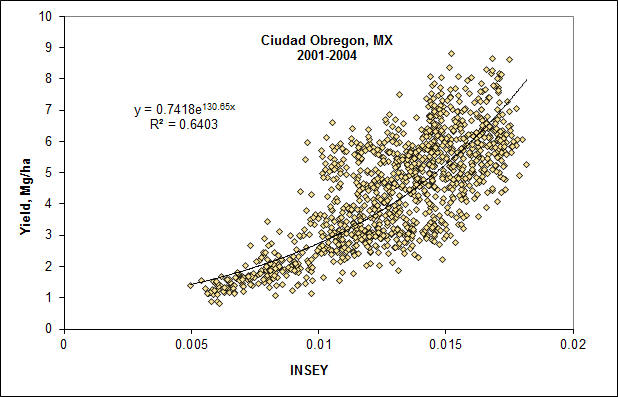
Use of CV's for this area in Mexico could help to improve the yield prediction equation. Understanding that the work from Ortiz-Monasterio and Sayre showed that despite severe early N deficiencies, maximum yields could still be achieved from mid-season fertilizer N applications. This is because the plant stands are usually really good, and this a result of post planting irrigation. This results in low CV's. The equation above includes some of the highly-N-stressed plots, but that had impecable stands. All plots included in this analysis were not fertilized mid-season as the objective was to refine yield prediction. Nonetheless, some of the highly stressed N plots still delivered in terms of yield, simply because the stands were so good. This is the present theory for the upper cluster of data that actually had a higher yield potential but likely undetected for lack of including the plot CV in addition to NDVI for yield prediction.
Note in the graph below (many trials from Ivan and Ken), that even with severe N stress, maximum yields could be achieved if N was applied later. This was thought to be due to the low CV's in Ciudad Obregon. This entire concept was the reason for the CV-algorithm.