 Can
CV's be used to better predict yield potential with added N?
Files:
RICV_new.xls
ATG_Corn.xls
ATG_Wheat.xls
OFIT_CornCV.xls
Algorithm Cook Book
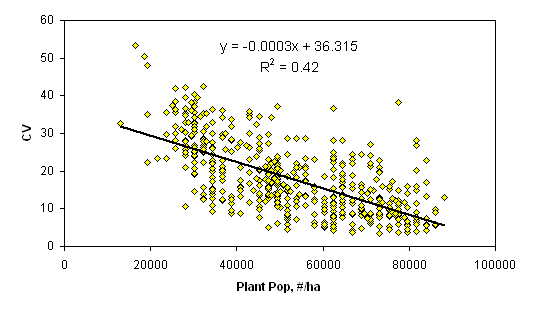
Relationship between CV determined from GreenSeeker (red) readings at V8 and measured plant population over 3 years and 6 locations.
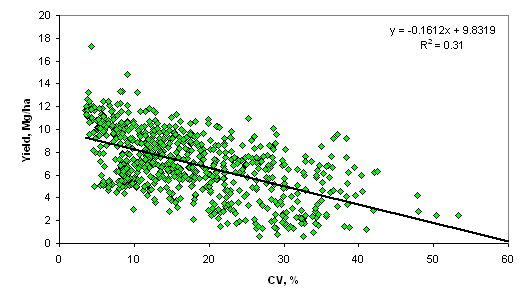
Relationship between measured CV at V8 using the GreenSeeker (red) handheld sensor and final corn grain yield over 3 years and 6 locations.
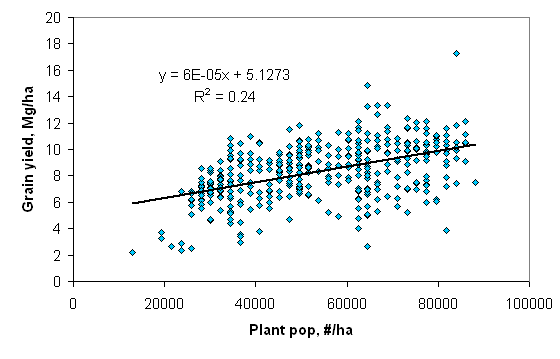
Relationship between plant population and grain yield over 3 years and 6
locations.
_files/RI_CV_4.gif)
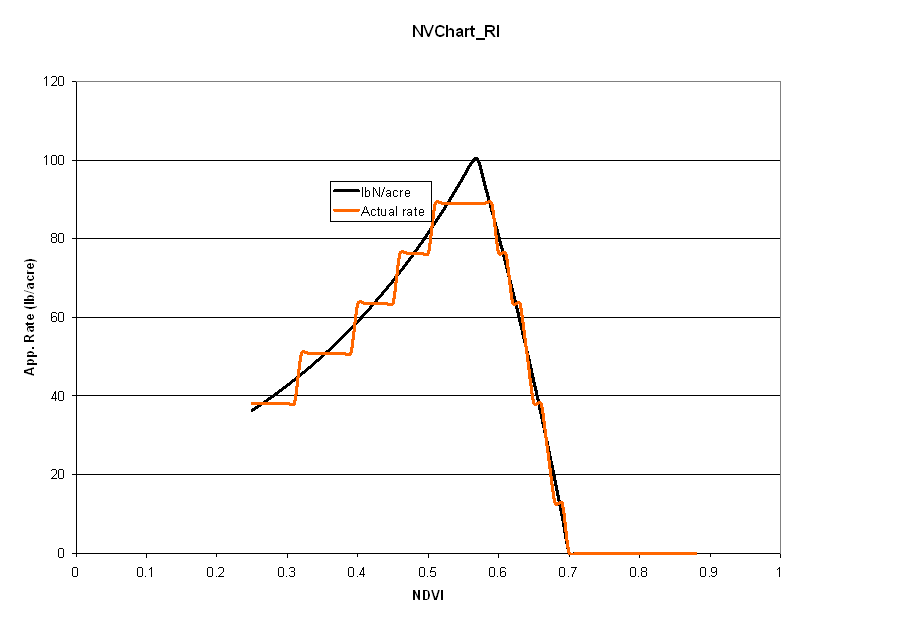
Current work focuses on using CV's and NDVI to refine sensor-based fertilizer N rate recommendations. When CV's are high, yields obtainable when fertilizer N is applied decrease. Fertilizer N is subsequently adjusted not only based on predicted yield potential, but the maximum yield that is capped by CV's. An infinite number of N application sequences is possible, and tailored to farmer conditions using INSEY (in-season estimated yield) and the response index (RI) determined using the pre-plant applied N rich strip.
_files/rate_change.jpg)
| NDVI (FP) | NDVI (NRS) | Planting Date | Sensing Date | |||||
| 0.45 | 0.69 | 4/30/2003 | 6/10/2003 | |||||
| Yield Potential Curve | System | Algorithm | ||||||
| Irrigated | YP0 = 2332.9*EXP(INSEY*132.46) | |||||||
| Dryland | YP0 = 1633*EXP(INSEY*132.46) | |||||||
| NUE | Dryland | 1633 | ||||||
| 0.6 | 0.5, 0.6, or 0.7 | Average N Rate to Be Applied | ||||||
| RI | Days from Planting to Sensing | Grower/Field Name | ||||||
| 1.53 | 41 | Test | ||||||
| Max Yield, bu/ac | Field Description | |||||||
| 250 | Test | |||||||
| NDVI (FP) | NDVI (NRS) | Planting Date | Sensing Date | |||||
| 0.45 | 0.69 | 4/30/2003 | 6/10/2003 | |||||
| Yield Potential Curve | System | Algorithm | ||||||
| Irrigated | YP0 = 2332.9*EXP(INSEY*132.46) | |||||||
| Dryland | YP0 = 1633*EXP(INSEY*132.46) | |||||||
| NUE | Dryland | 1633 | ||||||
| 0.6 | 0.5, 0.6, or 0.7 | Average N Rate to Be Applied | ||||||
| RI | Days from Planting to Sensing | Grower/Field Name | ||||||
| 1.53 | 41 | Test | ||||||
| Max Yield, bu/ac | Field Description | |||||||
| 150 | Test | |||||||

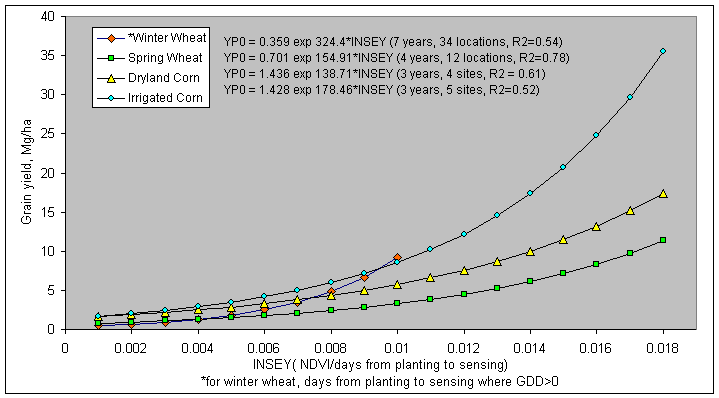
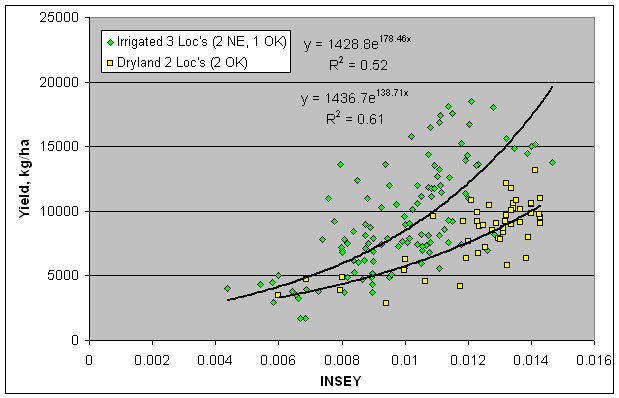
In the figure above 4 yield potential equations are reported for winter wheat, spring wheat, dryland corn and irrigated corn. As is noted, the 4 equations are really quite similar. This is important when considering that the winter wheat equation came from data in Oklahoma, spring wheat from North Dakota, South Dakota, and Mexico, and Corn (both irrigated and dryland), from Mexico, Nebraska, and Oklahoma. Each production region (country or state specific) may well have minor adjustments that are needed (variety, planting date, etc.), but for the most part these yield potential predictive equations should be accurate. Regardless, what is apparent here is that all grain yield prediction equations will have the same form. The importance of the yield potential equations is that they accurately reflect what the "yield potential" will be for the growing conditions encountered within a specific year. "Yield potential" changes from year to year in the exact same field, largely due to temporal variability. Also, looking at the graphs, our estimate of yield potential is the "yield" you hope to grow given the "current" growth rate (on the day of sensing), thus, the outer edge of the data set is used, and estimated by adding 1 standard deviation along the entire exponential curve. For all crops (see figures below), very few data points were encountered in the upper left hand corner, noting that this outer edge represented a rather clean upper boundary. As is noted above, the YP0 equation for wheat is somewhat different that the other crops, largely because many of the days from planting to sensing have GDD<0 (growing degree days or Tmin+Tmax/2 - 4.4°C), where growth is not possible. The growth curve (biomass produced per day), estimated using NDVI (excellent predictor of biomass) has proven to be a reliable parameter for estimating harvested grain yield in winter wheat, spring wheat, and corn (both dryland and irrigated). Actual data for all equations is shown below.
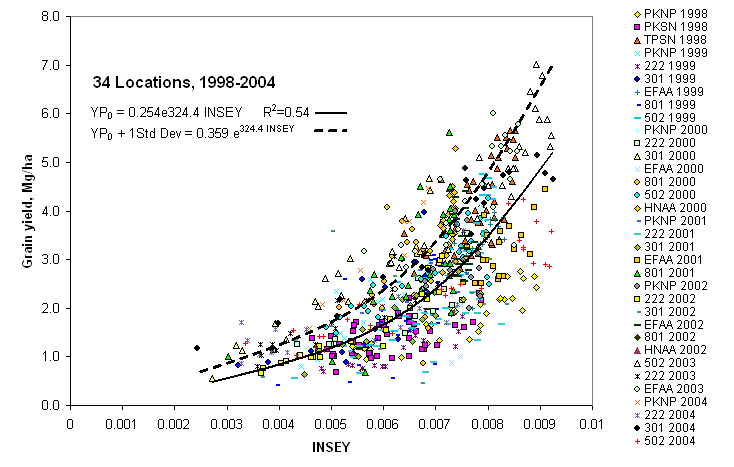
Relationship between INSEY (NDVI collected once at Feekes 5, divided by the days from planting where GDD>0) over 34 sites, 1998-2004 for Winter Wheat (by site above, all sites below).
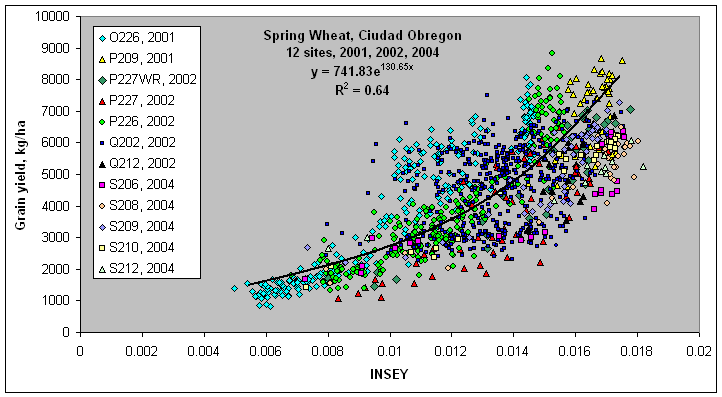
Relationship between INSEY (NDVI collected once at Feekes 5, divided by the number of days from emergence to sensing) over 12 sites, 2001-2004 for Spring Wheat in Ciudad Obregon, Mexico.
