

email:
bill.raun@okstate.edu
Last update: March 30, 2021
Research Methods in Plant and Soil Sciences
SOIL 5112,
spring, odd years
Class Survey Results, 2019
| ASK the Right Questions, Right Order, Right Product | Deliver a Product |
| Puzzle | Research Methods 2013 |
| Stay focused | |
| Unrelenting effort |

Anthropegenic (pollutants originating from human activity)
Relationship between mean square errors and wheat grain yields in long-term experiments
LIVE SITE: Atmospheric CO2

Jorge Hirsch (2005, H-index) How to improve your H-index
Graduate Commencement, Friday May 7
CLASS FINAL, 2021 (Friday April 29, 8:00 am)
(https://online.okstate.edu/) by clicking the link labeled "Course Evaluations
. . . . Or you try to internalize it in such a way that it really becomes intuitive. Working on the right problem is only part of what it takes to succeed. Perseverance is another essential ingredient." Steven Chu
Last update: March 30, 2021
Surface Response Models (Regression Page)
 Routine, Monthly Activity, By Day Records,
 Experiment 502 data (to 2018)
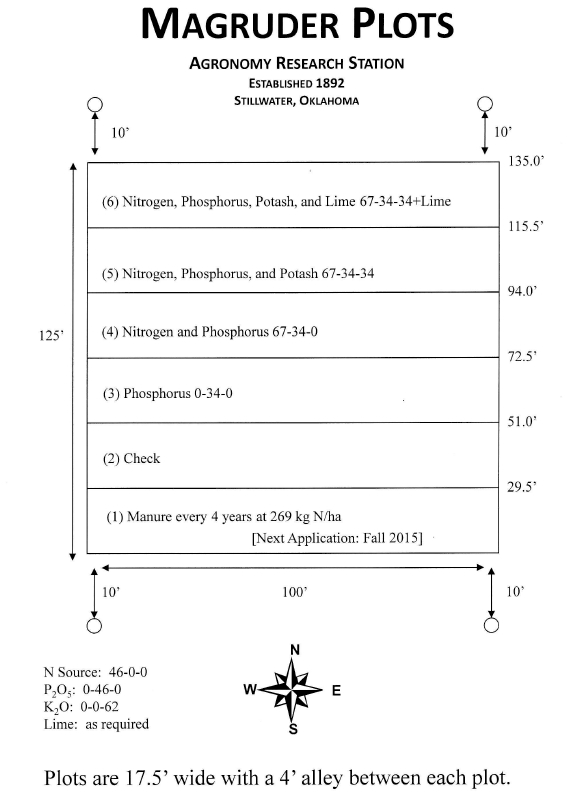
Experiment 502 plot plan
Wheat Growth Stages
Looking Back
VIRTUAL SAS
-
Use the following LINK
https://it.sp.okstate.edu/itservices/4help/entry.aspx?entry=F78H445168
LSD = t,dfe,alpha 0.05 *SED
T Table
OFT-Misused Mean Separation Procedures
Tuesday/Thursday 8:00 am, Ag Hall 401
Basic Research (defined)
Applied Research (defined) (Borlaug Borlaug-2)
Academic butterflies
Philosophical understanding of what we are doing


Use of the impact factor in agriculture. CSA News, Am. Soc. Agron. July issue, Madison, WI
Relationship between mean square errors and wheat grain yields in long-term experiments. J. Plant Nutr. Taylor & Francis
Swallow, Willima H. 1984. Those overworked and oft-misused mean separation procedures - Duncan's, LSD, etc. American Phytopathological Society. October, 919-921.
Frozen versus Non-Frozen Sample Preparation for Plant Tissue Phosphorus Analysis. Commun. Soil Sci. Plant Anal. 20:197-211.
Emergence of Corn as Affected by Source and Rate of Solution Fertilizers Applied with the Seed. J. Fert. Issues. 3:18-24. (PDF)
Economic and Agronomic Impacts of Varied Philosophies of Soil Testing. 1982. Agron J. 74:492-499.
Washington Post: Too much of too little (November 2013)
Independence of Biological Processes in Agriculture 2019
 Supply of food under threat due to biodiversity loss across the globe: UN
report
Supply of food under threat due to biodiversity loss across the globe: UN
report Southern Corn Leaf Blight
F Computation
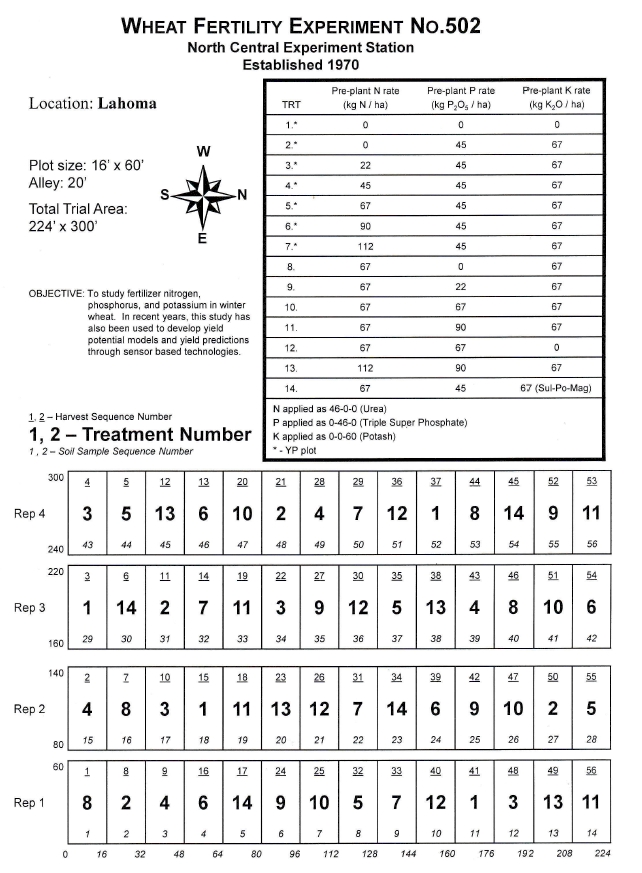
Contrast Coefficients
Duncans Table 5%
Duncans Table 1%
Checklist for Troubleshooting Non-estimatable Contrasts
(Proc Univariate Example) Proc Rank
1.
Experimental error is random, independent and normally distributed about a
zero mean with a
common variance.
2. Treatment and
environmental effects are additive.
** (Link,
W.G. Cochran, 1947) **
Relationship between mean square errors and wheat grain yields in long-term experiments. J. Plant Nutr. Taylor & Francis
 THE WALL, Dr. Borlaug
 CIMMYT
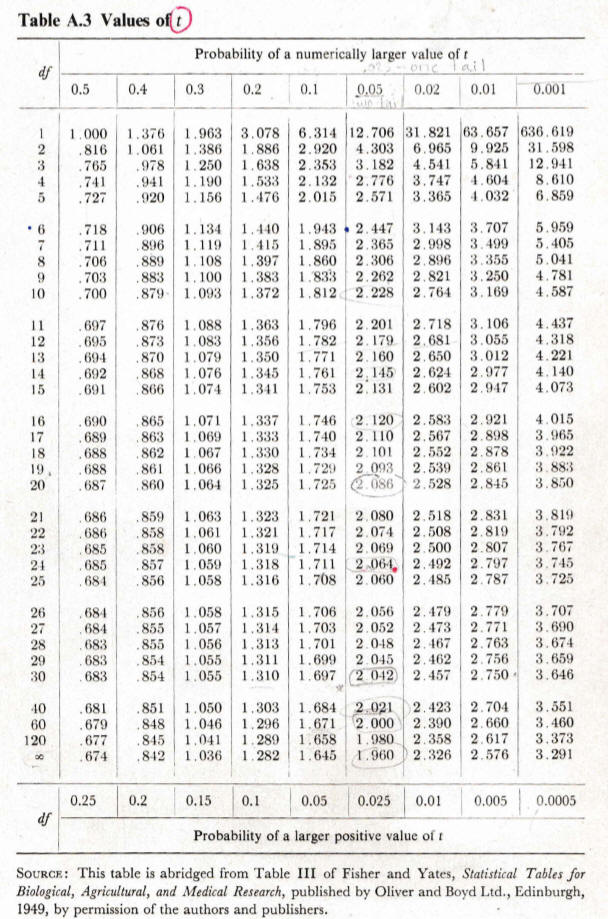 Mean Separation:
Calculation of the SED
Mean Separation:
Calculation of the SED(Everything other than the variables being evaluated should be held constant)
Tyler Lynch SAS Program (variability about each treatment mean) outliers
* * RCBD versus CRD, computing df * *
EFFICIENT DESIGN
STABILITY ANALYSIS
HOMEWORK #2
a. compute the F-Test for combining any two years (not covered in class), need SAS printout. Run glm analysis by year and over years (combined). 3 sets of treatment means (year 1, year 2, combined). Do the "combined" treatment means make sense? Or have we removed treatment differences that were present when analyzed "by-site"?
b. treatment means (by year and combined) Does this change your conclusions (use the treatment structure) given for 502
HOMEWORK #3
What is a salient question that has not been answered in your scientific discipline? Please cite relevant literature documenting the need
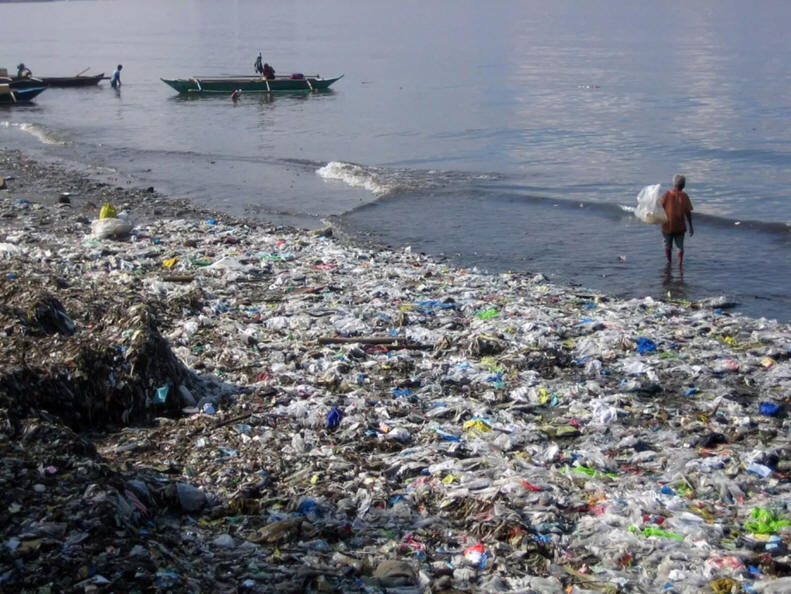 Biodegradable Plastics (Mexico)
By 2050, there will be more plastic than fish in the world’s oceans
Experiment 502 (data)

Data for Class (2/21/2019)
HOMEWORK #4
From experiment 502, generate a linear model of NDVI versus grain yield for 3 different year periods. The SAS printout will do. Provide a written interpretation of what you found, and what the R2 values were for each relationship. What percent of the variability in y (yield) was explained by x (NDVI)?
HOMEWORK #5
Using the SAS program provided in class, generate a functional surface response model using two random sources of data plotted against a dependent variable that you measured. Example, NDVI, at Feekes 4 and NDVI at Feekes 5, versus grain yield or "buac" in Experiment 502.
HOMEWORK #5.5 (READ all of the Covariance Page)
Homework # 5.6 (Read Churchill Eisenhart Article)
Homework # 5.7 (Find a data set that used/employed qualitative data/scores). Run proc univariate to see if the data was normal. Then run Proc Rank to normalize the data.
Homework #6
For the data set included, decipher whether or not the covariate was significant in removing variability in maize grain yield. Output needs to include GLM results, and significant levels of main effects using the appropriate error term to test the effect. Tillage is "split" in this trial, so you need to have 2 error terms. You should also include: 1. treatment means, and standard deviation, 2. least square adjusted means . The Covariate is "preP" or preplant soil test phosphorus.
data one;
input rep nrate tillage yield preP;
cards;
1 0 0 20 16
1 50 0 25 13
1 100 0 29 13
1 150 0 35 14
1 0 1 35 18
1 50 1 35 16
1 100 1 38 11
1 150 1 39 19
2 0 0 20 22
2 50 0 26 23
2 100 0 30 21
2 150 0 32 25
2 0 1 36 19
2 50 1 36 11
2 100 1 37 18
2 150 1 40 16
3 0 0 17 18
3 50 0 22 19
3 100 0 25 28
3 150 0 29 22
3 0 1 29 13
3 50 1 34 25
3 100 1 38 24
3 150 1 40 18
Homework #7
Please edit-assemble and run a linear-plateau model (non-linear regression) for data of your own, or data from one of your fellow students. Output and data used are required.
PROC PRINT: "Hello SAS, What do you think I sent you"
1. Combining sites (SAS 502 DATA, 2012, 2013, 2014, 2015, 2016)
2. SAS: 502, 2015 and 2016 data, glm, by site, over sites, means, plots
3. NDVI various Stages versus Yield (2/21 and 2/23, 2017)
4. Exp. 502, by-year, SED example, 2008, 2009, 2010 (kg/ha conv. to bu/ac)
5. Blake Farrow Program (no differences in locations)
6. 502_surface response model (diamond/pyramid shapes)
Orthogonal/non-orthogonal contrasts, over lapping of sums of squares
7. Proc iml and interaction contrasts
8. ( start by going over the treatment structure )
Contrast EXAMPLE ( Eva ) (PLOT PLANS)
9. Covariance, Autocorrelation
10. By-Plant Corn Studies (go to by-plant studies)
11. Cate-Nelson Procedure, Linear Plateau (middle of entry page)
Link to
Cate-Nelson SSSAJ 35: 658:661
Best example we have is BRUNO/MG, NDVI data (combined program) (as txt file)
what is the Critical Level
Linear-Linear (bottom of Regression Page)
Linear Plateau (Dennis Wallin)
12. When should I block, How should I block? (go to bottom of covariance page)
13. Difference between two independent Regression Equations
14. Stability Analysis
15. Output Means to a New Data SET
CV corn versus CV wheat
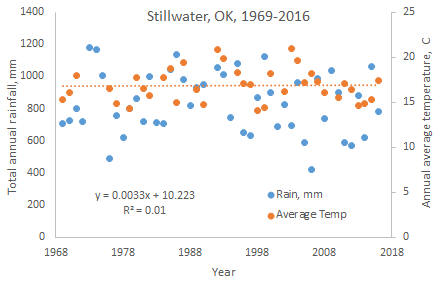
Weather Patterns, 502 Similarities in Environment
16. CV over time (pdf article) best time to treat variability abstract
ADVANCED: Output treatment means and output "statistics"
 abstract
As usable energy is irretrievably lost, disorganization, randomness and chaos increase (https://www.allaboutscience.org/second-law-of-thermodynamics.htm, visited June 19, 2018). This is aligned with the second law of thermodynamics that embeds knowledge that the total entropy of an isolated system can never decrease over time, where entropy is the degree of disorder or randomness in the system (Costa et al., 2002).
17. Testing for a Normal Distribution
18. Split Plot in Space and Time
Abstract, PUE
"One shot to the head, or 5 in the chest and bleed to death" Time we all do not have
Accounting for all sources of "error" (rep*trt*year is the error term)
START: Finishing writing, importance, skills
| suggests | indicates | tended |
| suggested | indicated | tended to show |
| showed | documented | provided |
| revealed | provided | illustrated |
| quantified | evidenced | illuminated |
| communicated | estimated | proved |
Combining sites (SAS Program)
SAS 502 DATA, 2012, 2013, 2014, 2015, 2016
Environment (Location, Year, Experiment #, Greenhouse, etc.)
1. Homogeneity of error variance?
2. Did conclusions change after sites were combined? (Could I have homogeneity of error variance, and still see different treatment responses at 2 different sites/years?)
3. How to identify outliers (SD about a mean)
rules associated with removing outliers
MISC
Output, Log, and Editor Screens (how are they
used)
Error messages, Log messages
creating data sets (excel)
(see program below on combining sites)
(cut and paste data)
to excell CTL-alt-V (will paste your line text into columns)
data set structure
character variables, use of $ ( input rep trt loc $ )
missing data (use GLM)
rep-trt in the same cell (101, 102, 103)
Physical Design, Plot Plans

RCBD vs CRD, and Contrasts (link goes to RCBD and CRD examples)
Checklist for Troubleshooting Non-estimatable Contrasts
1. The "Experimental Method" (defined)
2. The "Scientific Method"
3. Formulation of hypotheses
a. 15 Steps to Good Research (Georgetown)
b. Advice on Research and Writing (ASA abstract)
4. By-Plant Corn Studies
Collecting Added Data: When is this useful?
Why collect Added
Data?
Who is the expert on your particular study?
Discussion
(Testing) (Forage N Uptake/Calibration, excel file), go
to Sheet 3
Univariate, Testing for a Normal
Distribution
Jana Disease Data
New Algorithm 2007
8. Applied Statistical Procedures
-regression versus ANOVA
-Cate-Nelson and Linear-Plateau
Mean Separation: Calculation of the SED
SED = square root (2*MSE/reps) = square root (2*s2/reps)
2. Stability Analysis (excel) (Treatment by environment interactions, N Rate Example)
(example for agronomic experiments, Use of Stability Analysis for Long-Term Soil Fertility Experiments. Agron J. 85:159-167)
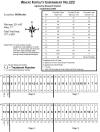
3. Magruder excel file
1. Apurba Trial (depth)
2. Sarah, Genotype by Environment Interaction (class sas program)
3. Jeremiah (complete factorial) (class sas program)
Discuss treatment 13 vs rest 'contrast'
4. Lecture, 2/15
5. Lecture, 2/17
http://dasnr.adobeconnect.com/soil5112
“Enter as a Guest”, enter your name, click “Enter Room”, Can enter questions/comments in the chat window.
Mixed vs GLM (popular press)
Mixed example, Sulu
Mixed EXAMPLE (for 2015 Class)


